

Reading a barograph trace and the tropical pressure wave
1The lesson in plain words
A barograph draws pressure against time. Its shape shows fronts, squalls and settled weather at a glance, and in the tropics a twice-daily wave you must allow for.
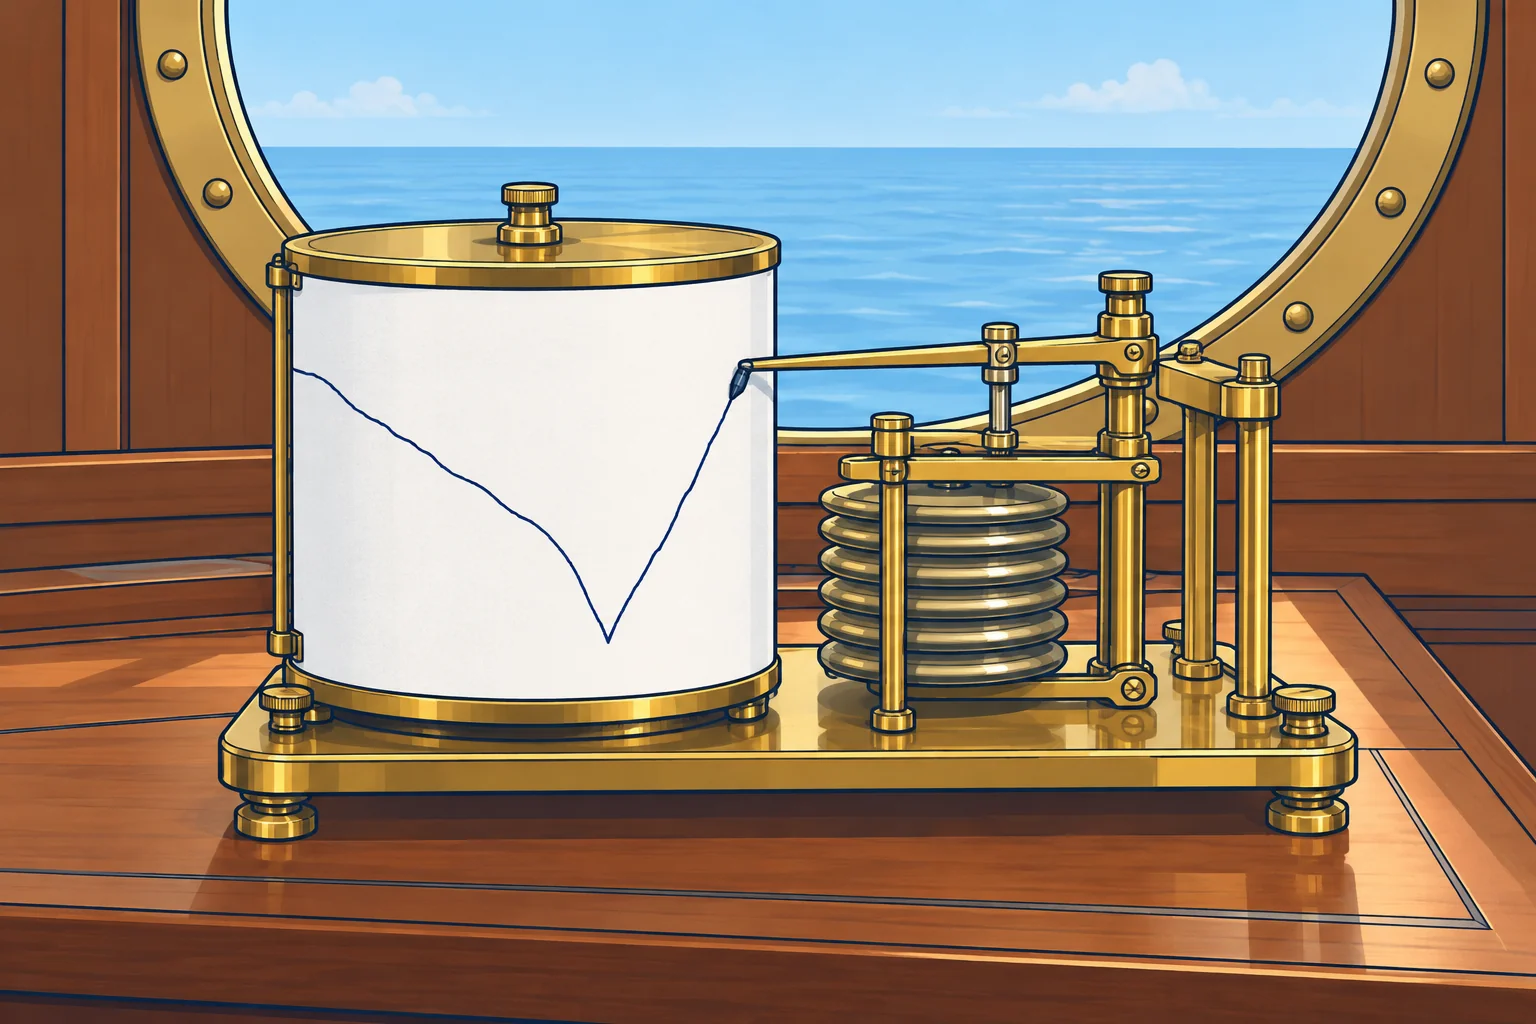
What a barograph shows
A barograph records pressure continuously, on a paper drum or as a graph on a screen. You see the whole recent story, not just two readings. Look at the slope: the steeper it is, the faster the change. Look at the turning points: they often mark a front or trough. Mark the time of wind shifts and showers on the trace or in the log.
Shapes to know
A long, steady fall can signal an approaching low or warm front. Levelling may accompany a warm-front passage. A V-shaped bottom followed by a sharp rise often accompanies a cold front or trough. A flat or gently rising trace is common under a high or ridge. Check these clues against wind, sky and the forecast.
Squall jumps
A sudden step up of 1 hPa or more in a few minutes, against the general trend, often marks a squall or thunderstorm. Cold air rushing out of the storm is denser and raises the pressure under it. The jump often arrives with the first strong gust and a drop in temperature. The Squalls unit shows what to do about them.
The tropical pressure wave
Within about 30° of the equator pressure rises and falls twice a day: the twice-daily pressure tide. Highs come at about 1000 and 2200 local solar time, lows at about 0400 and 1600. Solar noon is when the sun crosses your meridian. The range can reach about 3 hPa between high and low.
Allowing for it
Keep your regular readings and watch rapid changes. To help separate the twice-daily tide from other changes, also compare with the same local solar time yesterday. Check the forecast, sky and sea before drawing conclusions; see Tropical storms.
2Key data
- Steady fall for hours
- Low or warm front approaching
- V-shaped low point, sharp rise
- Cold front or trough passing
- Sudden jump of 1 hPa or more
- Often a squall or thunderstorm outflow
- Tropical highs / lows (local solar time)
- About 1000 and 2200 / about 0400 and 1600
- Tropical daily range
- Up to about 3 hPa; also compare at yesterday’s local solar time
3Key points
- 1
The slope shows how fast pressure changes; turning points often mark fronts.
- 2
A V-shaped low point with a sharp rise usually marks a cold front.
- 3
A sudden small jump against the trend often comes with a squall.
- 4
Tropics: pressure peaks about 1000/2200 and dips about 0400/1600 local solar time.
- 5
In the tropics, also compare with the same local solar time yesterday; keep monitoring short-term changes.
4Frequent mistakes
Wrong: In the tropics, an afternoon fall of 2 hPa warns of a storm.
Right: Pressure normally dips towards 1600 local solar time. Also compare with the same solar time yesterday; keep watching recent changes.
Wrong: A trace that has stopped falling means the bad weather is over.
Right: Levelling only shows that pressure has stopped falling. Check the wind, sky and latest forecast before deciding conditions are improving.
5Practice case & exam keys
Sailing at 15° N in the trade winds, your barograph shows a regular wave. All times are local solar time. Today at 1600 it reads 1011.5 hPa; yesterday at 1600 it read 1012.0 hPa. At 1000 today it read 1014.0 hPa. A crew member is worried. What do you say?
Show the answer
The fall is consistent with the daily pressure tide: 1000 is near a high and 1600 near a low. Today's 1600 reading is only 0.5 hPa below yesterday's. That is not alarming alone, but the comparison cannot rule out a recent rapid change. Keep checking the recent trace, sky and sea, and get current forecasts and warnings.
Exam keys
- Barograph: slope = rate of change; turning points often mark fronts.
- V-shaped trace then sharp rise: cold front or trough.
- Twice-daily pressure tide: highs about 1000/2200, lows about 0400/1600 local solar time.
- In the tropics also compare with the same local solar time on the previous day.
Finish this unit
When you've read it, match the terms, then answer three questions. Get them all right to finish the unit; opening the page alone doesn't count.
My notes for this unit
No notes