
Routeing charts and pilot charts: the climate of an ocean, month by month
1The lesson in plain words
Routeing and pilot charts show the average winds, currents, gales and ice for each month. Use them to choose the season and the route, not to navigate.
Climate, not forecast
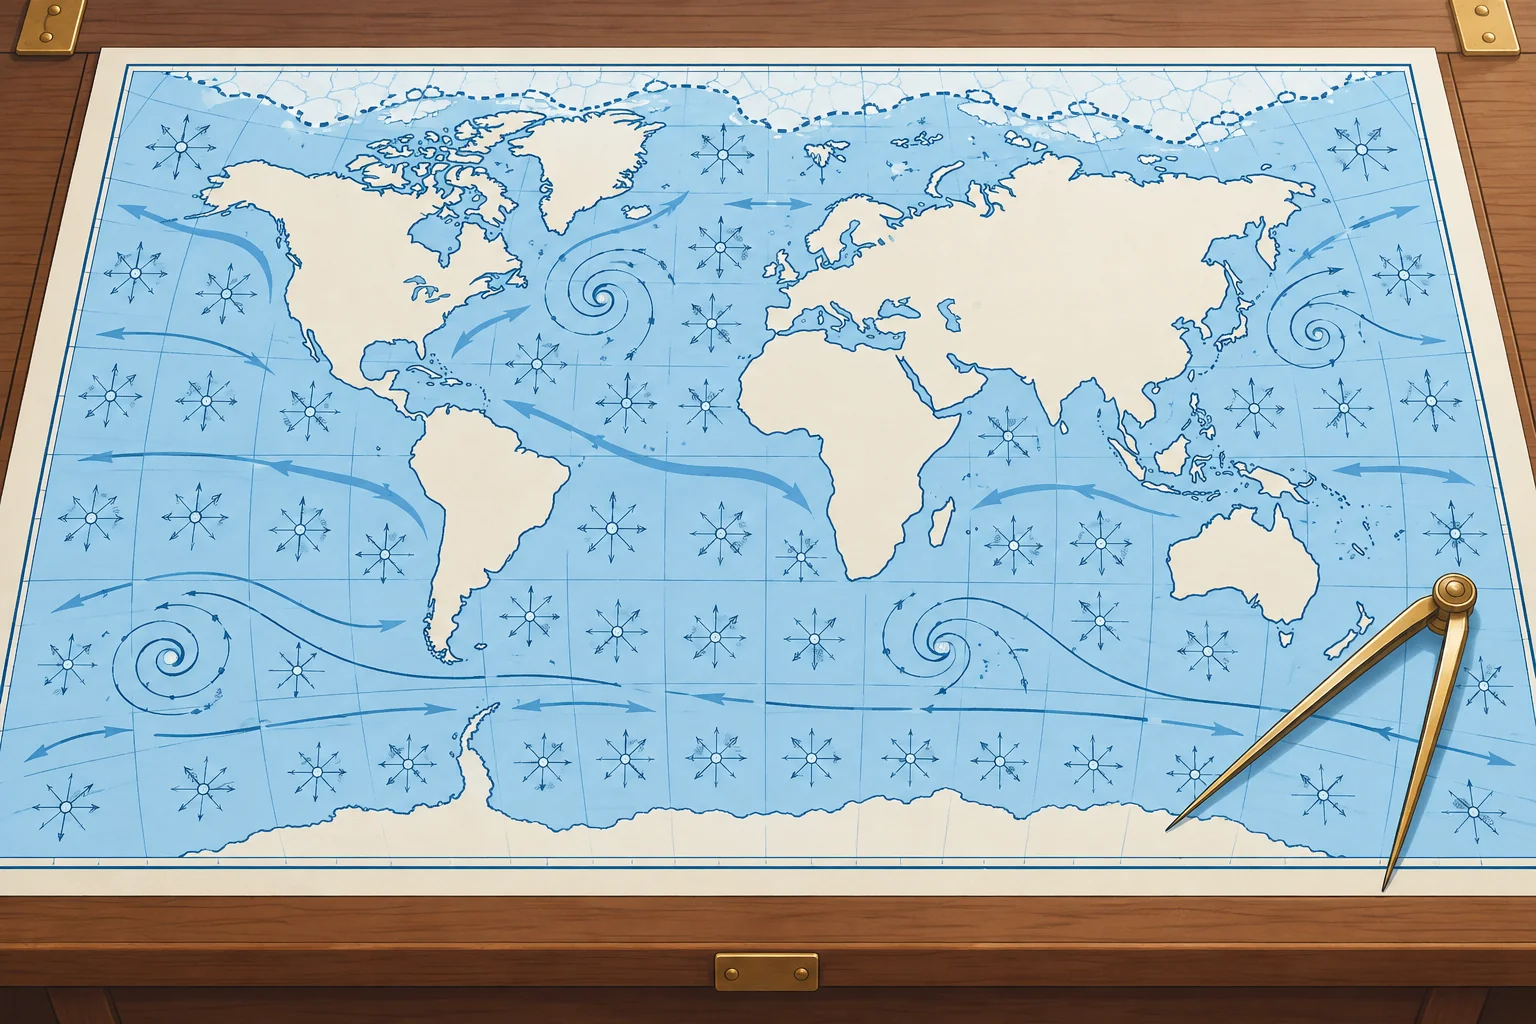
An ocean passage starts with climatology: what usually happens in that place and month. Two families of charts give it. ADMIRALTY Routeing Charts from the UK Hydrographic Office cover each ocean with one chart per month; chart 5124 is the North Atlantic. The US NGA Atlas of Pilot Charts does the same in five volumes, Pubs. 105–109; Pub. 106 covers the North Atlantic. Both are for planning only, never for navigation.
What they show
Each monthly chart shows wind roses at regular intervals, average ocean currents with their direction and rate, ice limits, recommended ship routes and distances, and the tracks of tropical and extratropical storms. Panels or insets add the frequency of gales, sea and air temperature, pressure, visibility and, on pilot charts, how often waves exceed about 12 feet (3.7 m). Routeing charts also show the load line zones that apply to ships.
Reading a wind rose
A wind rose summarises the wind in one square of ocean for that month. Each arrow flies with the wind towards the centre of the rose, from the direction the wind comes from. Its length shows frequency on the chart scale. On NGA charts, above 29 %, the shaft is broken and a number gives the percentage; read the legend. Its feathers show the average Beaufort force. The number in the centre circle gives the percentage of calms.
Currents and ice
Current arrows show the set, the direction the water flows towards, and a figure gives the average rate in knots. Ice limits show the mean and the extreme extent of icebergs and sea ice for the month. The Ocean currents unit explains the main currents; the Global winds unit explains why the wind belts sit where they do.
Averages hide extremes
North-east winds on 70 % of observations, averaging force 4, still allow stronger or weaker north-east winds, other directions and calms. Use the charts to pick the month with the best odds, then plan for the worst you could reasonably meet and check real forecasts before and during the passage.
2Key data
- ADMIRALTY Routeing Charts
- UKHO, one chart per month per ocean; 5124 = North Atlantic
- Atlas of Pilot Charts
- NGA, five ocean volumes; Pub. 106 = North Atlantic
- Wind rose arrow length
- Unbroken length = frequency; NGA above 29 %: broken shaft + number
- Wind rose feathers
- Average Beaufort force from that direction
- Centre of the rose
- Percentage of calms
- Current arrow
- Set (direction towards) and average rate in knots
3Key points
- 1
Routeing and pilot charts give monthly averages of wind, current, gales, ice and storm tracks.
- 2
Use them to choose the month and route, never to navigate.
- 3
Wind rose: unbroken length gives frequency (NGA above 29 %: number), feathers force, centre calms. Read the legend.
- 4
A current arrow gives the set, where the water goes, and the rate.
- 5
Averages hide extremes: check forecasts before and during the passage.
4Frequent mistakes
Wrong: A long wind-rose arrow means strong wind from that direction.
Right: Unbroken length shows frequency; on NGA charts, above 29 %, a number gives it on a broken shaft. Feathers show average force.
Wrong: A pilot chart can stand in for the weather forecast.
Right: It shows climate, the averages of many years. Weather on the day can be very different.
Wrong: Name a current like a wind: an arrow pointing west is an easterly current.
Right: Currents are named for where they go: an arrow pointing west shows a current setting west.
5Practice case & exam keys
Suppose the pilot charts at 20° N, 30° W show north-east winds on 55 % of observations in November, averaging force 4, with 6 % calms. December has 70 % north-east winds, averaging force 5, with 2 % calms. Which month offers better odds, and what else do you check?
Show the answer
December offers more frequent north-east winds and fewer calms, but a higher average force. Strength varies within the north-east winds: they can be stronger or weaker than force 5. The remaining 30 % includes other directions and calms. Check storm tracks, gale frequency and currents along the route, your boat and crew’s limits, and current forecasts before choosing.
Exam keys
- Routeing charts (UKHO) and pilot charts (NGA): monthly climatology for planning, not for navigation.
- Wind rose: unbroken length = frequency; NGA above 29 %: broken shaft + number. Feathers = force; centre = % calms.
- They show currents, ice limits, storm tracks, gale frequency, routes and distances.
- Current set is the direction towards which it flows; rate in knots.
Finish this unit
When you've read it, match the terms, then answer three questions. Get them all right to finish the unit; opening the page alone doesn't count.
My notes for this unit
No notes