

Tidal curves: height at a time and time for a height
1The lesson in plain words
A standard port's tidal curve turns HW and LW into a height for any time, or a time for any height, better than the rule of twelfths.
The curve diagram
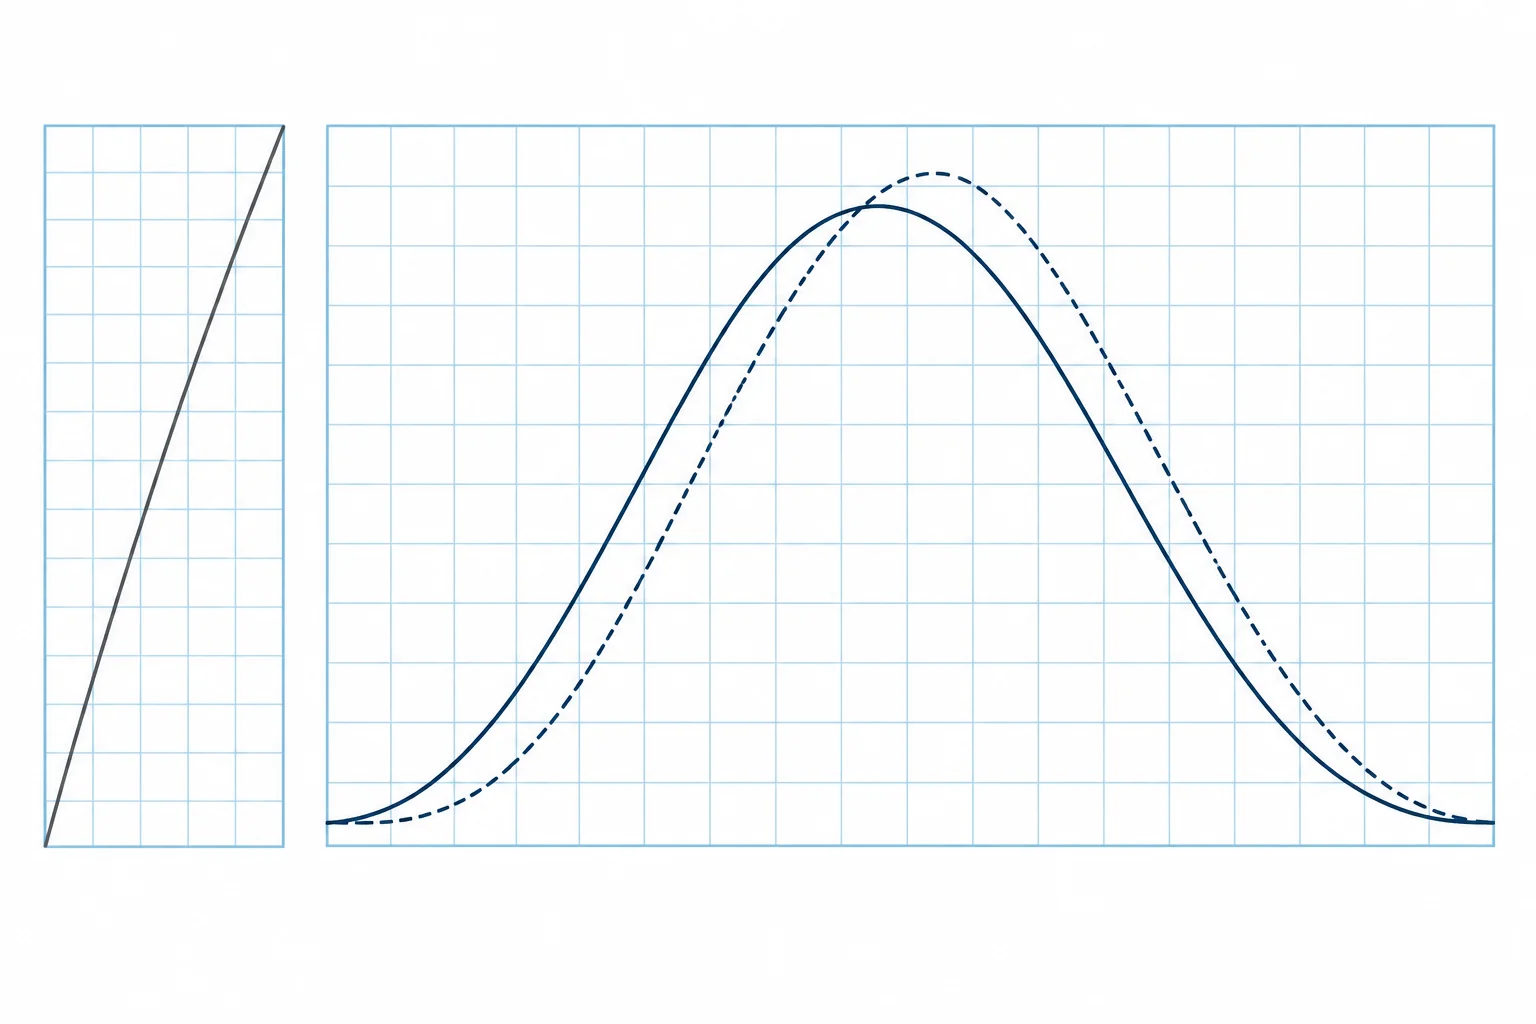
A standard-port tidal curve shows hours before and after HW. Enter today's HW time. Use the preceding LW for the rising branch and the following LW for the falling branch; their heights may differ. The factor runs from 0 at the relevant LW to 1 at HW. On the height grid, join that LW height on the bottom scale to the HW height on the top scale. This line converts the factor to height above chart datum.
Springs and neaps
Many curves show two lines: solid for mean springs and dashed for mean neaps. Work out today's range (HW height − LW height) at the standard port and compare it with the mean spring and neap ranges printed beside the diagram. Interpolate by eye between the two curves; beyond springs, use the spring curve. With mean ranges of 4.4 m and 2.2 m, a 3.6 m range lies about two thirds of the way towards springs.
Height at a time
Use the secondary-port tide from the last lesson: HW 0830 4.3 m, LW 1507 1.0 m, so the range is 3.3 m. You want the height at 1130, HW+3. Go up from HW+3 to the falling (right-hand) side of the curve; suppose it gives a factor of 0.60. Height of tide = LW + factor × range = 1.0 + 0.60 × 3.3 = 3.0 m above chart datum. The line on the height grid does the same multiplication for you.
Time for a height
Reverse it to find when there is enough water. You need 2.5 m on the falling tide: factor = (2.5 − 1.0) ÷ 3.3 = 0.45. Find 0.45 on the falling side and read the time scale. Suppose the curve gives about HW+3h40: 1210. After 1210 the tide is lower than 2.5 m. For a rising tide, recalculate with the preceding LW and use the left-hand side, counting from HW.
Which curve and how good
For a secondary port, use the standard port's curve with the secondary port's HW and LW, unless the tables give a curve of its own. The result is a prediction: wind and air pressure can change the real height by a few tenths of a metre, so keep a margin. Spanish Patrón de Yate exams set both problems: the depth at a given time, and the time for a given depth (problema directo e inverso).
2Key data
- Factor
- 0 at LW, 1 at HW
- Height of tide
- LW + factor × range
- Factor for a needed height
- (Needed height − LW) ÷ range
- Spring or neap curve
- Interpolate by today's range at the standard port
- Time scale
- Hours before and after the HW time written in the box
- Spanish terms
- Altura de marea, sonda en un momento, problema inverso
3Key points
- 1
The curve gives a factor from 0 at LW to 1 at HW; height = LW + factor × range.
- 2
Choose between the spring and neap curves by today's range at the standard port.
- 3
For a needed height, compute the factor first, then read the time off the curve.
- 4
A secondary port normally uses its standard port's curve with its own HW and LW.
4Frequent mistakes
Wrong: Use the spring curve every day.
Right: Compare today's range with the mean spring and neap ranges, and interpolate between the curves.
Wrong: Read the falling side of the curve for a time before HW.
Right: Before HW the tide is rising: use the left-hand side. After HW use the right-hand side.
Wrong: Treat the predicted height as exact.
Right: Weather moves the sea by tenths of a metre. Keep a margin on every height you depend on.
5Practice case & exam keys
You have allowed for charted depth, draught and your margin: you need a height of tide of 3.0 m. LW is 1.2 m; HW is 4.8 m at 1415. On the rising curve, factor 0.5 occurs at HW−2h50. Can you justify starting a crossing at 1120?
Show the answer
No. Range = 3.6 m; required factor = (3.0 − 1.2) ÷ 3.6 = 0.5. The predicted threshold is reached at 1125, five minutes after your planned start. Your margin is already included. Check actual conditions and confirm sufficient water throughout the crossing before proceeding. Use the falling curve to find when the window closes.
Exam keys
- Height of tide = LW + factor × range.
- Factor needed = (required height − LW) ÷ range.
- Interpolate between spring and neap curves by today's range.
- Rising tide: left side of the curve; falling tide: right side.
Finish this unit
When you've read it, match the terms, then answer three questions. Get them all right to finish the unit; opening the page alone doesn't count.
My notes for this unit
No notes