

Forecasting from a chart
1The lesson in plain words
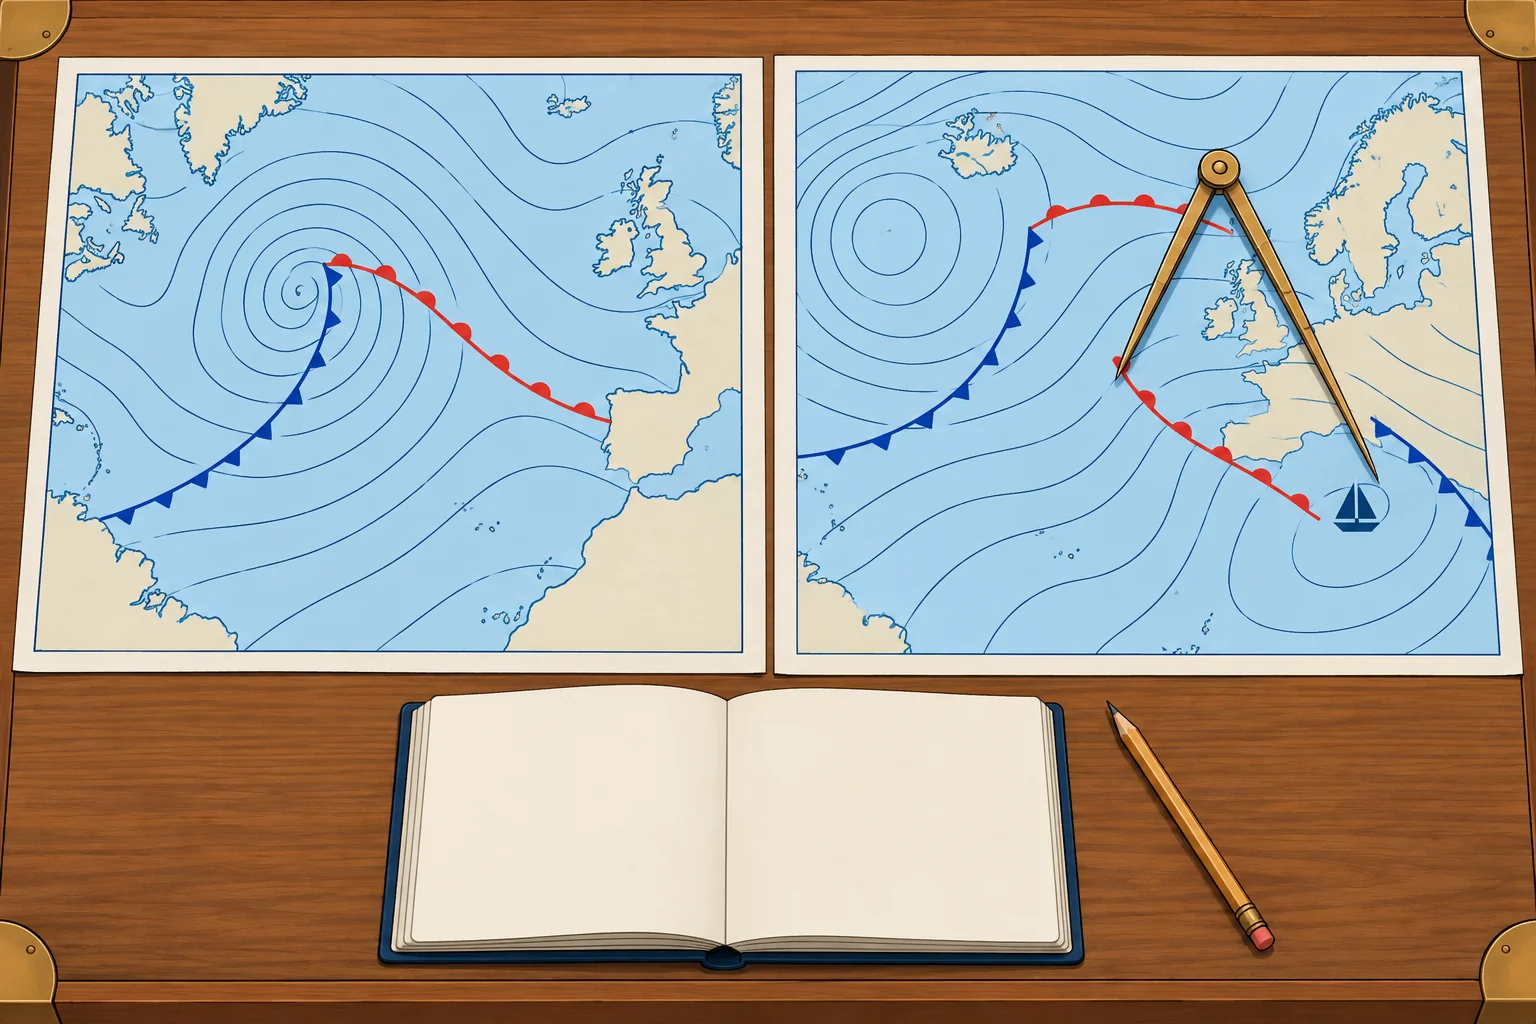
Read the wind at your position, then compare successive charts to see which systems are approaching and when.
Your wind now
Put your position on the chart. In the Northern Hemisphere, wind above surface friction blows along the isobars with low pressure on your left, with your back to the wind. Back it 10–20° for the sea surface. Estimate speed from the spacing or geostrophic scale, then reduce it to about two-thirds to three-quarters. Near tightly curved isobars, this simple conversion is less reliable; check the official wind forecast.
What is coming
Scan upwind, but do not assume systems follow your surface wind. Mid-latitude systems often move eastwards. Compare successive forecast charts at their valid times to establish the tracks of lows, fronts and troughs. Note whether a low’s central pressure falls (deepening) or rises (filling), and whether nearby isobars tighten.
Timing
For a fixed position, measure distance along the front's approach track; nautical miles (NM) divided by its approach speed in knots gives hours. Compare positions and valid times on successive charts to estimate that speed. A front 120 NM away approaching at 20 knots arrives in about 6 hours. Treat this as a rough guide: fronts speed up, slow down or stall.
Expected changes
For a typical frontal low moving east in the Northern Hemisphere, passing north of you with both fronts crossing your position, wind often backs ahead of the warm front and veers at each front. A track south usually brings backing overall. These are guides: check the actual front positions and isobars. Tightening isobars suggest strengthening wind; a weak-gradient ridge usually brings lighter wind.
Check it
Compare your chart reading with the official forecast, the barometer trend and the sky. If they disagree, check updated charts and forecasts before trusting your estimate.
2Step by step
Reading the next 24 hours from forecast charts
- 1
Check the valid time of each chart and put them in order.
Each chart is one moment; the order shows the movement.
- 2
Mark your position on each chart.
Use the same position to track local weather changes over time.
- 3
Read wind direction and speed from the isobars, then back and reduce it for the sea surface (NH).
The scale gives a geostrophic estimate; tight curvature changes it.
- 4
Follow each low, high and front from chart to chart and estimate its speed.
Distance along a front's approach track ÷ its approach speed gives a rough arrival time.
- 5
Predict the wind shifts: veer or back, and where isobars tighten.
This shows how wind direction and strength may change at your position.
- 6
Cross-check your chart reading against the official forecast, barometer trend and sky.
Differences show where your estimate needs checking against updated information.
3Key data
- Arrival time
- Distance along approach track (NM) ÷ approach speed (kn) = hours
- Example
- Front 120 NM away approaching at 20 kn → about 6 hours
- Typical east-moving frontal low north (NH)
- Both fronts cross you: often backs ahead, then veers at each front
- Typical east-moving frontal low south (NH)
- Usually backing overall; check actual front positions and isobars
- Tightening isobars
- Wind increasing
4Key points
- 1
Read your local wind, then compare successive charts to track systems and changes in their central pressure.
- 2
Distance along the approach track ÷ approach speed gives a rough front arrival time.
- 3
Typical east-moving frontal low north (NH), both fronts crossing: often backs ahead, then veers at each front.
- 4
Check the chart against the forecast, barometer and sky.
5Frequent mistakes
Wrong: Your surface wind tells you where approaching systems come from.
Right: Local airflow and system movement can differ. Compare system positions on successive charts at their valid times.
Wrong: A front's arrival time from a chart is exact.
Right: Fronts speed up, slow down and stall. Allow several hours either way and keep checking.
6Practice case & exam keys
At 0600 UTC in the Northern Hemisphere, an active north–south cold front is 150 NM west of you, moving east. The chart valid at 1800 UTC puts it 30 NM west. Ahead, isobars run SW–NE with low pressure to the NW and are tightening. Estimate its arrival and likely wind changes.
Show the answer
It moves 120 NM in 12 hours: 10 knots. At that speed it reaches you about 2100 UTC, though timing can change. Expect a strengthening wind from roughly south-south-west to south-west ahead, then a veer towards west to north-west with a typical cold-front passage. Squalls and rain are possible, with rising pressure and showers behind. Cross-check the official forecast, barometer and sky.
Exam keys
- Read your local wind and scan upwind; track approaching systems on successive charts, independently of local airflow.
- Successive charts show movement, deepening or filling; distance ÷ speed gives timing.
- Always cross-check charts with the official forecast and the barometer.
Finish this unit
When you've read it, match the terms, then answer three questions. Get them all right to finish the unit; opening the page alone doesn't count.
My notes for this unit
No notes