

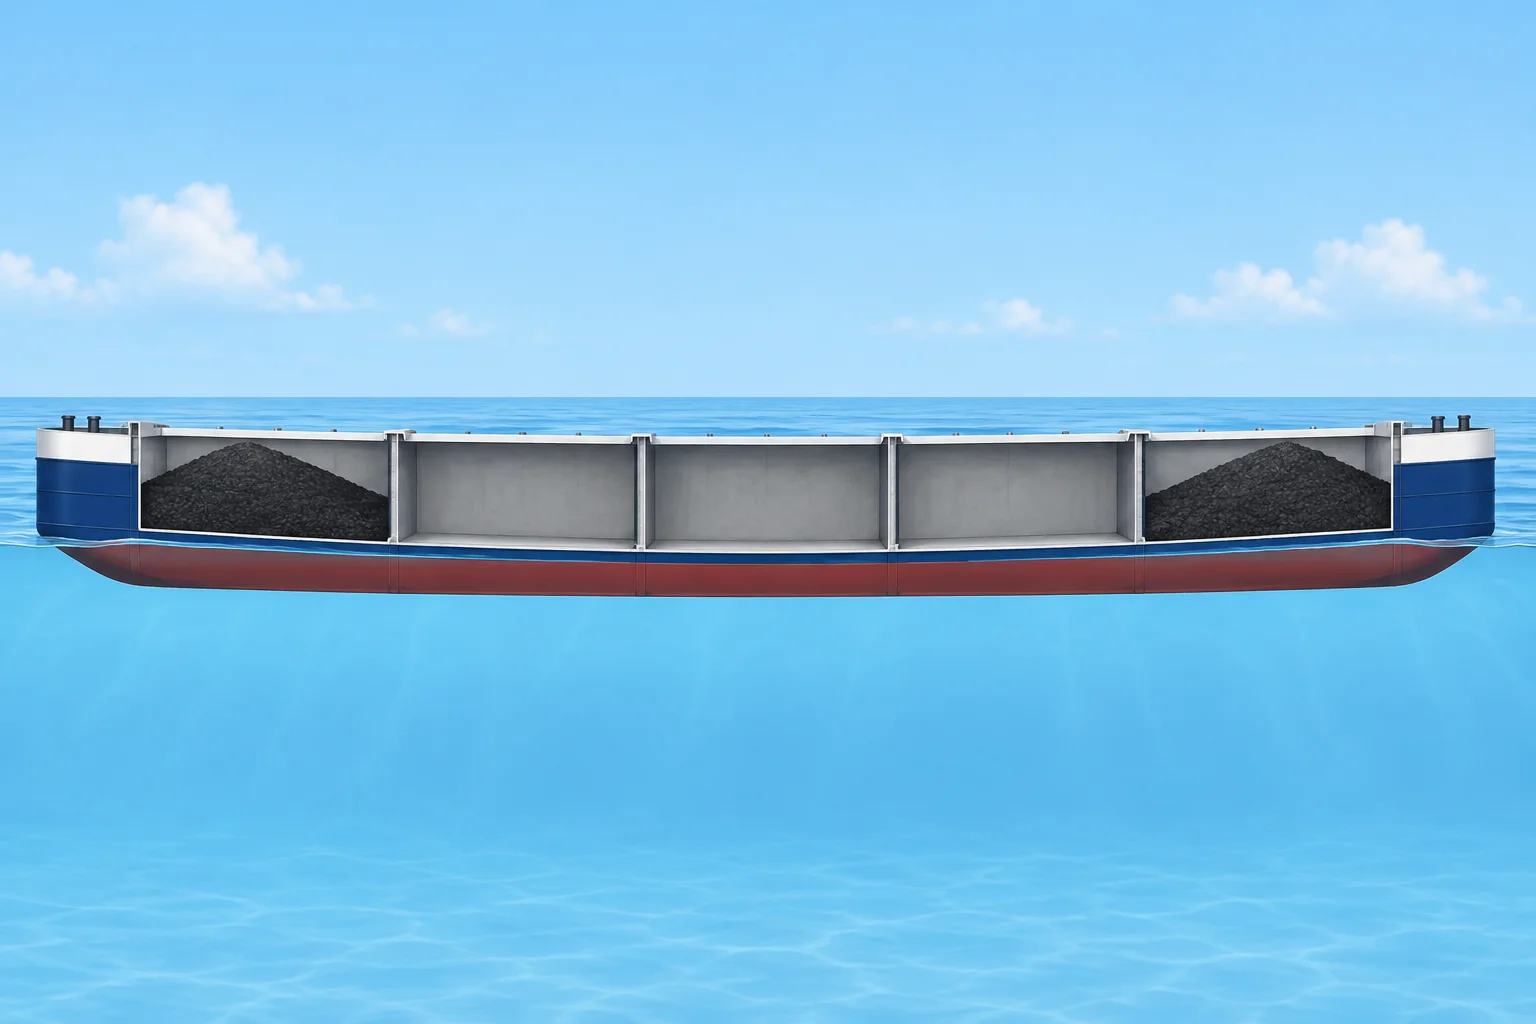
Shear force and bending moment along the hull
1The lesson in plain words
Weight and buoyancy can differ along a ship. This loads the hull girder, the hull acting as a beam, through shear force and bending moment.
Two distributions
Picture the ship cut into short slices. Each slice has its own weight: steel, cargo, fuel, ballast. Each also gets its own buoyancy from the water it displaces. In total the two balance, so she floats. Slice by slice they rarely match. Where weight exceeds buoyancy the slice wants to sink; where buoyancy wins it wants to rise. The difference per metre is the load curve, in tonnes per metre (t/m).
Shear force
The shear force (SF) at a station is the net load added up from one end of the ship to that station, in tonnes. It tries to slide one part of the hull vertically past the next. SF is zero at both ends. It peaks where the load curve changes sign, often near the quarter lengths or at a heavy hold next to an empty one.
Bending moment
The bending moment (BM) at a station is the shear force added up along the length, in tonne-metres (t·m): the area under the SF curve. BM is zero at both ends and greatest where SF passes through zero, usually near midships. A large BM bends the whole hull like a beam. Don’t confuse it with BM, the metacentric radius of stability.
Computer units
In stress tables, t means tonne-force: the weight force of one tonne. Many loading computers show SF in kilonewtons (kN) and BM in kilonewton-metres (kN·m). Divide by 9.81 to compare: 180,500 kN is about 18,400 t; 1 t·m is about 9.81 kN·m.
Why the officer cares
Excessive SF can buckle or crack side shell and bulkheads near heavy holds. Excessive BM can fracture deck or bottom plating amidships. You control both through the order in which you load, discharge and ballast. The next lessons cover hog and sag, then stress limits and the loading instrument.
2Step by step
Worked example: SF and BM on a box barge
- 1
Set up the barge: 100 m long, five 20 m compartments, lightship 1,000 t spread evenly (10 t/m). Load 600 t in each end compartment.
Displacement is 2,200 t. A level box barge has uniform buoyancy: 2,200 ÷ 100 = 22 t/m.
- 2
Find the load curve. Weight is 10 + 600 ÷ 20 = 40 t/m at the ends and 10 t/m in the middle. Net load = weight − buoyancy.
Ends +18 t/m (too heavy), middle −12 t/m (too buoyant). The net load sums to zero.
- 3
Shear force 20 m from the end: 18 × 20 = 360 t.
SF is the net load summed from the end. It peaks here, where the load changes sign.
- 4
Shear force at midships: 360 − 12 × 30 = 0 t.
SF passes through zero, so BM is at its maximum here.
- 5
Bending moment 20 m from the end: area under the SF triangle = ½ × 20 × 360 = 3,600 t·m.
BM is the area under the SF curve from the end.
- 6
Bending moment at midships: 3,600 + ½ × 30 × 360 = 9,000 t·m.
Add the signed areas under the SF curve from the end to midships.
3Key data
- Load curve
- Weight − buoyancy per metre, in t/m
- Shear force (SF)
- Net load summed from one end to the station, in t
- Bending moment (BM)
- Area under the SF curve from one end, in t·m
- Maximum BM
- Where SF passes through zero, usually near midships
- At the ends
- SF and BM are both zero
- Units
- 1 t ≈ 9.81 kN; 1 t·m ≈ 9.81 kN·m
4Key points
- 1
Weight and buoyancy balance in total but not slice by slice; the difference is the load curve.
- 2
SF is the summed load (t); BM is the summed SF (t·m).
- 3
Maximum BM occurs where SF crosses zero; SF peaks where the load curve changes sign.
- 4
Check whether the computer uses t and t·m or kN and kN·m.
5Frequent mistakes
Wrong: If the ship floats at her marks, the hull is not stressed.
Right: Total weight equals total buoyancy, but their spread along the length can still create large SF and BM.
Wrong: Shear force is greatest amidships.
Right: SF usually peaks near the quarter lengths, where the load changes. BM usually peaks near midships, where SF is zero.
Wrong: The BM on the stress screen is the metacentric radius.
Right: Here BM is the bending moment in t·m or kN·m. The metacentric radius BM of stability is a length in metres.
6Practice case & exam keys
A 100 m box barge has lightship 1,000 t spread evenly and 1,200 t of cargo. Compare loading all cargo in the middle 20 m compartment with 240 t in each of five 20 m compartments. Which gives less midships bending?
Show the answer
With cargo concentrated amidships, buoyancy is 22 t/m. Net load is −12 t/m outside the middle and +48 t/m inside. SF reaches −480 t at 40 m and returns to zero amidships. BM = −9,600 − 2,400 = −12,000 t·m. With 240 t per compartment, weight and buoyancy are both 22 t/m throughout: net load, SF and BM are zero. The even distribution gives less midships bending.
Exam keys
- Load = weight − buoyancy per metre; SF = summed load; BM = summed SF.
- SF is zero at the ends; BM is greatest where SF = 0.
- Use signed areas when adding the SF curve.
- Convert kN to t by dividing by 9.81.
Finish this unit
When you've read it, answer three questions. Get all three right to finish the unit; opening the page alone doesn't count.
My notes for this unit
No notes