

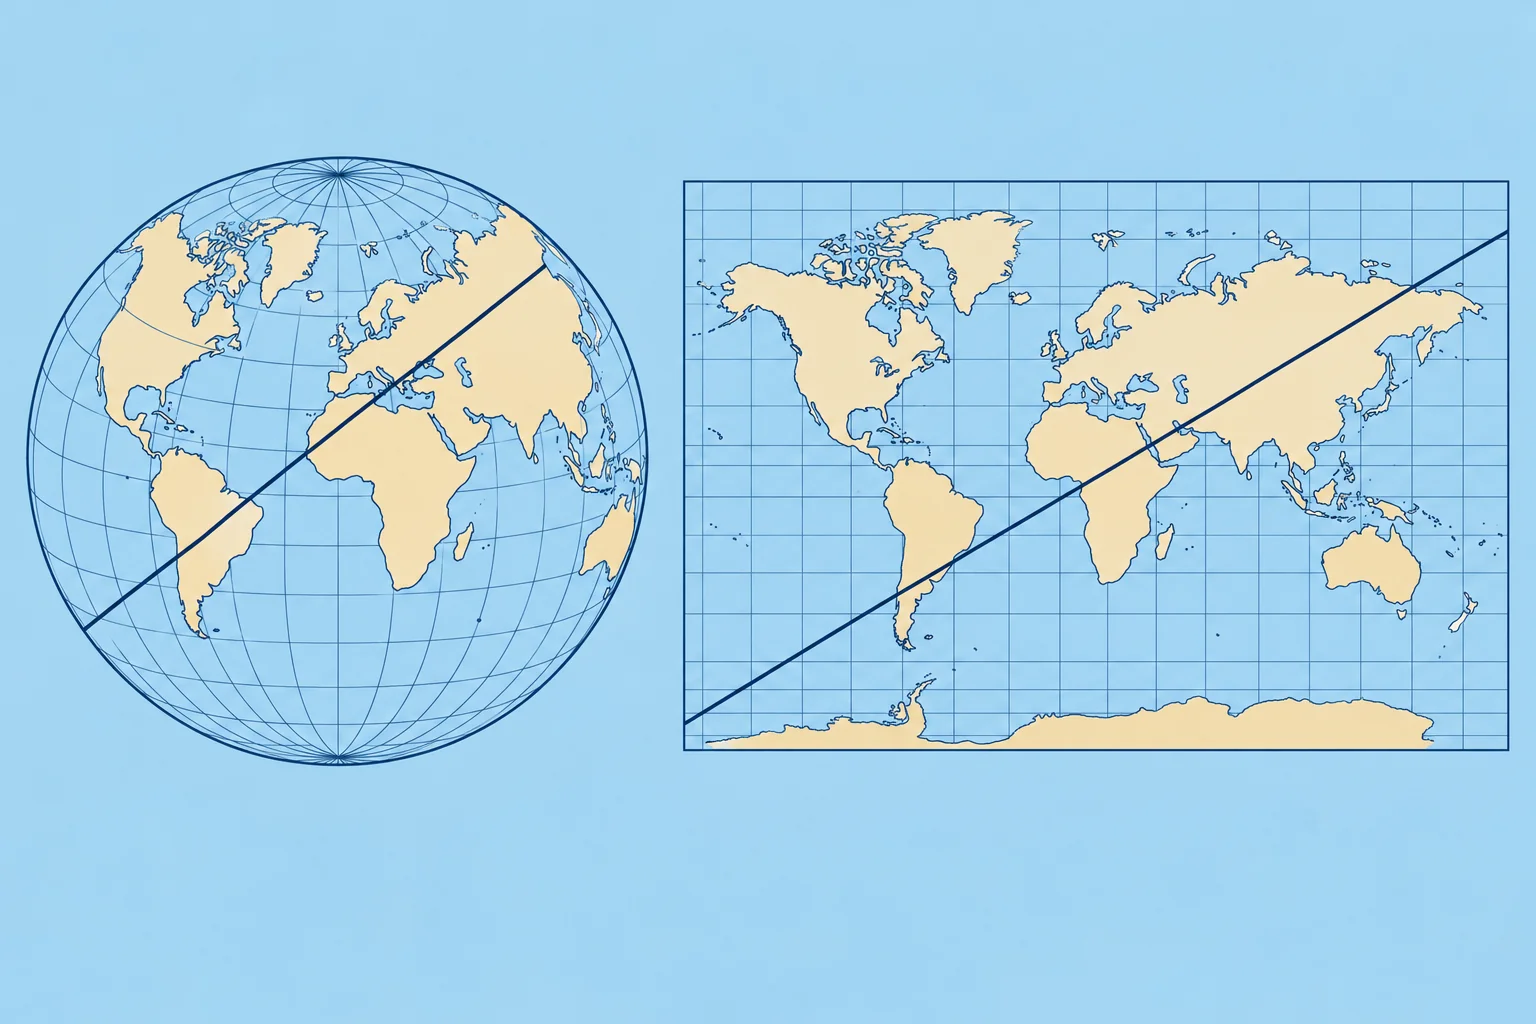
Mercator charts, scale and measuring distance
1The lesson in plain words
A straight line on a Mercator chart keeps a constant direction relative to true north. Use the latitude scale for distance and the largest-scale chart to navigate.
Why a projection
The Earth is round; a chart is flat. A projection is the method used to draw one on the other, and every projection distorts something. Most sea charts use the Mercator projection: meridians are drawn as straight parallel lines, and parallels as straight lines at right angles to them.
What Mercator keeps
Meridians never meet on the chart, so it stretches east–west away from the equator. To keep local shapes and angles right, it stretches north–south too: latitude minutes grow towards either pole. A straight line is a rhumb line, crossing every meridian at the same angle. Its direction relative to true north (towards the North Pole) stays constant; the heading you steer may need adjustment for wind and current.
Measuring distance
Open your dividers (a two-pointed measuring tool) across the distance, then lay them on the latitude scale beside it, at about the same latitude, and count the minutes: each minute is one mile. Never use the longitude scale at the top or bottom. On a chart that covers many degrees of latitude, measure a long leg in shorter steps, each against its own latitude.
Chart scale
The scale compares distance on the chart with distance on the Earth. At 1:50 000, 1 cm on the chart is 500 m. A large-scale chart, such as a 1:10 000 harbour plan, shows a small area in great detail. A small-scale chart, such as 1:1 000 000, covers a large area with little detail. Remember: large scale, large detail, small area.
Choosing the chart
Get the overview on a small-scale chart, then navigate on the largest-scale chart available for the water you are in: it shows more rocks, buoys and soundings. Some harbour plans carry their own distance scale bar; use it on that plan.
2Key data
- 1:50 000
- 1 cm on the chart = 500 m
- Distance
- Latitude scale, level with the leg: 1′ = 1 M
- Rhumb line
- Straight on Mercator; constant direction relative to true north
- Large scale
- e.g. 1:10 000: small area, most detail
3Key points
- 1
Mercator: meridians parallel; a straight rhumb line has a constant direction relative to true north.
- 2
Measure distance on the latitude scale, level with what you measure. Never the longitude scale.
- 3
Large scale (1:10 000) = small area, most detail. Small scale (1:1 000 000) = big area, little detail.
- 4
Navigate on the largest-scale chart available.
4Frequent mistakes
Wrong: Use whichever edge scale is nearest for distance.
Right: Use only the latitude scale at the sides. The longitude scale is shorter away from the equator and gives distances that are too big.
Wrong: 1:1 000 000 is a large-scale chart because the number is large.
Right: It is small scale: things look small. Large scale means a small number after the colon, such as 1:10 000.
Wrong: Any part of the latitude scale gives the same mile.
Right: On Mercator the scale grows towards the poles. Measure level with the distance you want.
5Practice case & exam keys
You need the distance between two headlands on a 1:200 000 chart at about 44°N. A crew member lays the dividers on the top scale and reads 15 miles. What do you tell them?
Show the answer
Use the latitude scale at the side, level with the leg at about 44°N. A minute of longitude here is only about 0.72 M, so 15 minutes on the top scale is roughly 11 M, not 15. Re-measure on the latitude scale, where each minute is one mile.
Exam keys
- On Mercator, a straight rhumb line has a constant direction relative to true north.
- Distance: dividers on the latitude scale at the same latitude, 1′ = 1 M.
- Scale 1:50 000 means 1 cm = 500 m; large scale shows more detail.
- Plan on small scale, navigate on the largest scale available.
Finish this unit
When you've read it, match the terms, then answer three questions. Get them all right to finish the unit; opening the page alone doesn't count.
My notes for this unit
No notes