
Meteorology · Level R4 · 5 parts · about 16 min
Forecasting on board: barometer, sky and sea
5 short parts: Barometer in use · Barograph traces · Sky signs · Sea signs · Obs and forecast. Each part explains the idea, then gives the points to remember, the common mistakes, a worked case and a practice question; the Academy unit adds all 30 check questions.
1 · Barometer in use
Using the barometer at sea
A barometer only forecasts when you read it at fixed times, work out the 3-hour change and act on it. Make the readings a habit, not an afterthought.

Trust the trend
Pressure systems taught you the tendency words, from falling slowly to falling very rapidly. Here you put them to work. A single reading tells you little; the change since your last readings tells you what the weather is doing now. Read at fixed times, at least every 3 hours on passage and every hour when the pressure falls. Always use the same instrument, so its own small error cancels out.
Check your instrument
Before passage, compare your reading with a nearby official sea-level pressure for the same time. Its index error is your reading minus the official value; subtract that error from each reading. Height matters little on a yacht: pressure falls about 1 hPa for every 8 m you rise, so a cabin barometer 2.5 m above the sea reads about 0.3 hPa low. Re-check after big temperature changes or a knock.
Work out the tendency
Take the latest reading minus the reading 3 hours earlier. Example: 1011.4 hPa at 1200 and 1007.6 hPa at 1500 is a fall of 3.8 hPa: falling quickly. At 1800 it reads 1002.9 hPa: another 4.7 hPa. The fall is accelerating: compare it with the wind, sky and latest forecast. Write the sign (+ or −) and the tendency word in your log every time.
Look at the shape
The characteristic of the tendency is its shape over the 3 hours: falling steadily, falling then steady, or falling then rising. A fall that slows and stops often marks a warm front passing. A fall that turns quickly into a sharp rise usually marks a cold front or trough. A quick rise after a low often brings strong, gusty wind behind it.
Electronic barometers
Many plotters and instrument displays log pressure and draw a graph. Set an alarm for a fall bigger than you are willing to ignore, for example more than 3.5 hPa in 3 hours. Check that the logged history survives a power cut. Keep a simple aneroid or handheld backup and write readings down, because a screen graph is lost when the electrics fail.
Key figures
- Tendency
- Latest reading − reading 3 hours earlier, with its sign
- Reading routine
- At least 3-hourly on passage; hourly when falling
- Height effect near sea level
- About 1 hPa per 8 m of height
- Worked example
- 1011.4 → 1007.6 hPa in 3 h = −3.8 hPa, falling quickly
- Spanish term
- Tendencia barométrica; barómetro aneroide
Remember
- Read the barometer at fixed times and log every reading with its time.
- Tendency = latest reading minus the reading 3 hours earlier.
- An accelerating fall is a warning to check other weather signs and the latest forecast.
- A fall turning into a sharp rise usually marks a cold front or trough.
- Know your instrument's index error and keep a written backup log.
Common mistakes
Wrong: Read the barometer only when the weather starts to look bad.
Right: Read it at fixed times all passage. Without earlier readings you cannot work out a tendency when you need it.
Wrong: Correct a yacht's barometer for height before every reading.
Right: On a yacht the height effect is a few tenths of a hectopascal. Apply the known index error; the tendency matters far more.
Wrong: The first rise after a low means the bad weather is over.
Right: A quick rise behind a low or cold front often comes with strong, gusty wind. Keep the reefs in until the wind eases.
Worked case
On passage your log shows 1016.0 hPa at 0600, 1014.2 hPa at 0900 and 1010.1 hPa at 1200. The morning forecast gave south-west force 4 to 5, increasing 6 later. What do you conclude?
Show the answer
The two 3-hour tendencies are −1.8 hPa (falling) and −4.1 hPa (falling quickly). The fall is accelerating, but these readings alone do not show that force 6 will arrive early. Get the latest forecast and warnings, prepare for the forecast increase, and change to hourly readings.
Practice question
The barometer read 1009.0 hPa at 1400 and 1004.6 hPa at 1700. What is the tendency?
- Falling slowly, −0.4 hPa
- Falling quickly, −4.4 hPa
- Falling very rapidly, −6.4 hPa
- Falling, a change of −2.4 hPa
Show the answer
Answer: B. 1004.6 − 1009.0 = −4.4 hPa in 3 hours: falling quickly, using the tendency terms from Pressure systems.
2 · Barograph traces
Reading a barograph trace and the tropical pressure wave
A barograph draws pressure against time. Its shape shows fronts, squalls and settled weather at a glance, and in the tropics a twice-daily wave you must allow for.
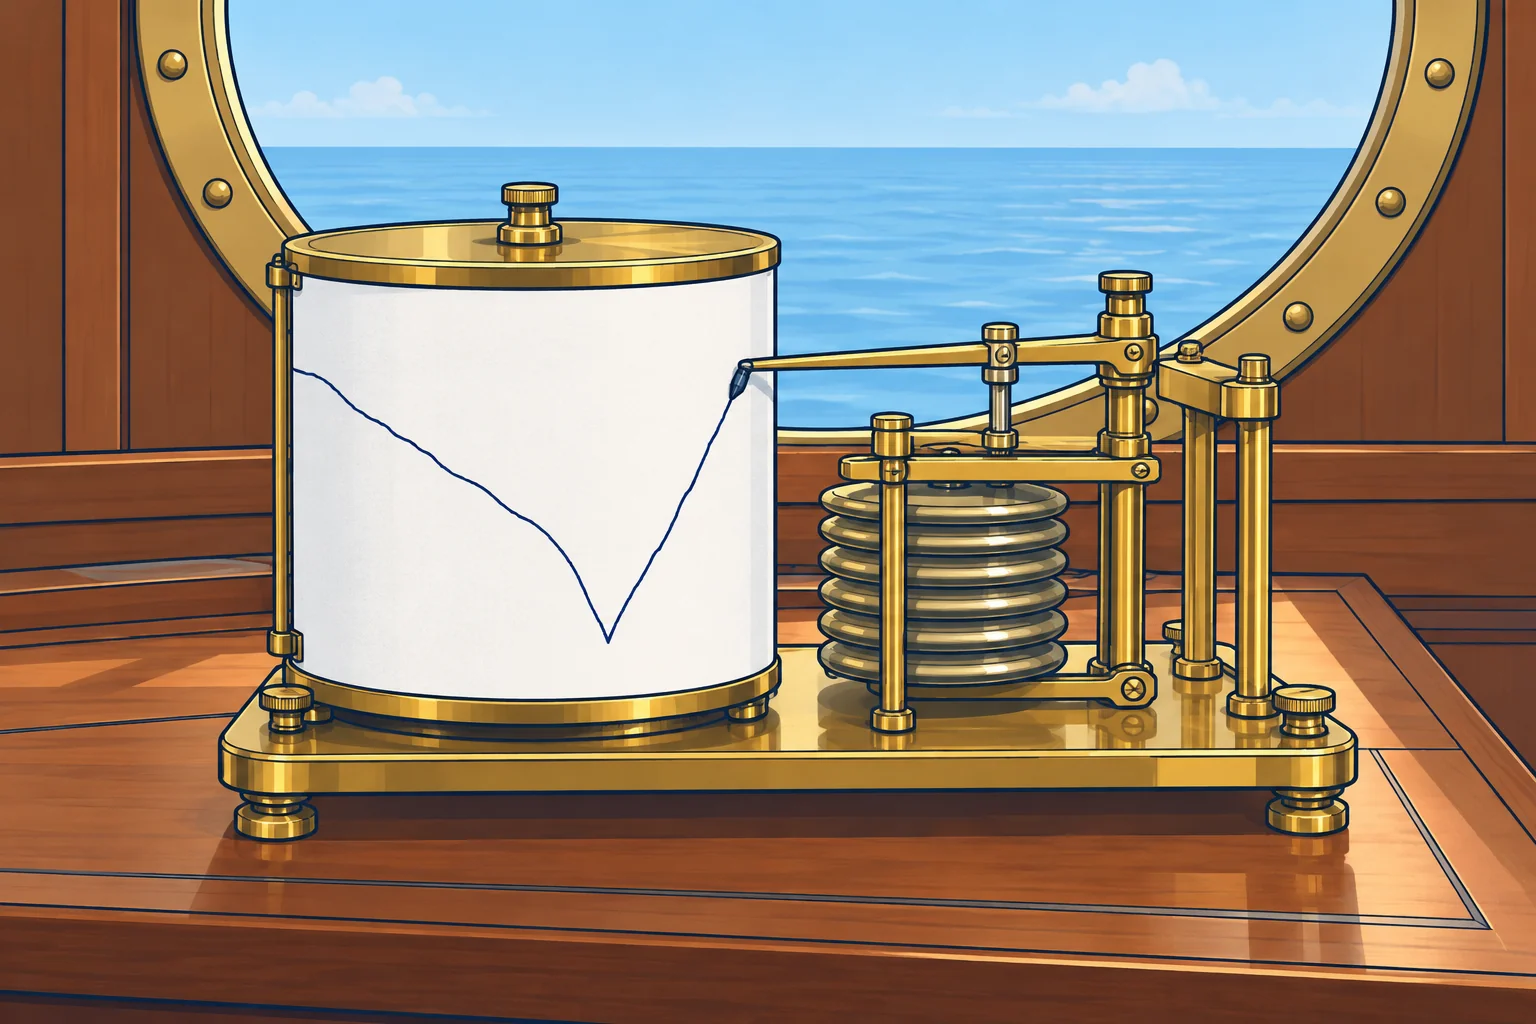
What a barograph shows
A barograph records pressure continuously, on a paper drum or as a graph on a screen. You see the whole recent story, not just two readings. Look at the slope: the steeper it is, the faster the change. Look at the turning points: they often mark a front or trough. Mark the time of wind shifts and showers on the trace or in the log.
Shapes to know
A long, steady fall can signal an approaching low or warm front. Levelling may accompany a warm-front passage. A V-shaped bottom followed by a sharp rise often accompanies a cold front or trough. A flat or gently rising trace is common under a high or ridge. Check these clues against wind, sky and the forecast.
Squall jumps
A sudden step up of 1 hPa or more in a few minutes, against the general trend, often marks a squall or thunderstorm. Cold air rushing out of the storm is denser and raises the pressure under it. The jump often arrives with the first strong gust and a drop in temperature. The Squalls unit shows what to do about them.
The tropical pressure wave
Within about 30° of the equator pressure rises and falls twice a day: the twice-daily pressure tide. Highs come at about 1000 and 2200 local solar time, lows at about 0400 and 1600. Solar noon is when the sun crosses your meridian. The range can reach about 3 hPa between high and low.
Allowing for it
Keep your regular readings and watch rapid changes. To help separate the twice-daily tide from other changes, also compare with the same local solar time yesterday. Check the forecast, sky and sea before drawing conclusions; see Tropical storms.
Key figures
- Steady fall for hours
- Low or warm front approaching
- V-shaped low point, sharp rise
- Cold front or trough passing
- Sudden jump of 1 hPa or more
- Often a squall or thunderstorm outflow
- Tropical highs / lows (local solar time)
- About 1000 and 2200 / about 0400 and 1600
- Tropical daily range
- Up to about 3 hPa; also compare at yesterday’s local solar time
Remember
- The slope shows how fast pressure changes; turning points often mark fronts.
- A V-shaped low point with a sharp rise usually marks a cold front.
- A sudden small jump against the trend often comes with a squall.
- Tropics: pressure peaks about 1000/2200 and dips about 0400/1600 local solar time.
- In the tropics, also compare with the same local solar time yesterday; keep monitoring short-term changes.
Common mistakes
Wrong: In the tropics, an afternoon fall of 2 hPa warns of a storm.
Right: Pressure normally dips towards 1600 local solar time. Also compare with the same solar time yesterday; keep watching recent changes.
Wrong: A trace that has stopped falling means the bad weather is over.
Right: Levelling only shows that pressure has stopped falling. Check the wind, sky and latest forecast before deciding conditions are improving.
Worked case
Sailing at 15° N in the trade winds, your barograph shows a regular wave. All times are local solar time. Today at 1600 it reads 1011.5 hPa; yesterday at 1600 it read 1012.0 hPa. At 1000 today it read 1014.0 hPa. A crew member is worried. What do you say?
Show the answer
The fall is consistent with the daily pressure tide: 1000 is near a high and 1600 near a low. Today's 1600 reading is only 0.5 hPa below yesterday's. That is not alarming alone, but the comparison cannot rule out a recent rapid change. Keep checking the recent trace, sky and sea, and get current forecasts and warnings.
Practice question
What does a long, steady fall on the barograph over many hours usually mean?
- A ridge is building over the boat
- A low or warm front is coming
- A cold front has just passed
- The diurnal tide has started
Show the answer
Answer: B. A long steady fall is the classic sign of an approaching low and its warm front.
3 · Sky signs
Reading the sky: fronts, showers and the crossed-winds rule
The sky shows what the air is doing above you. Use cloud sequences and cloud movement together with the barometer, never on their own.

A front announced
On board, watch whether high cloud spreads from upwind, thickens and lowers while the barometer falls. These signs support an approaching warm front. Often the first cirrus comes half a day to a day before the rain. Scattered cirrus that never thickens often means nothing.
Halo and mackerel sky
A halo is a ring round the sun or moon, usually about 22° from its centre. A mackerel sky is rippled cloud, like fish scales. Both can come ahead of a front, so watch whether the cloud thickens and lowers. Old sayings about them are only a prompt to look again.
Towers in the morning
Cumulus clouds that grow tall and hard-edged by late morning, called towering cumulus, show unstable air: showers or thunderstorms may follow later in the day. Small turrets on a mid-level cloud layer early in the morning, called altocumulus castellanus, are another warning of thunderstorms later. Flat, shallow cumulus that stays small usually means fair weather.
The crossed-winds rule
Watch which way the high or middle clouds move, compared with the surface wind. In the Northern Hemisphere, stand with your back to the surface wind. If the high clouds come from your left, the weather will probably get worse. From your right, it will probably improve. Parallel to the surface wind: little change. In the Southern Hemisphere, reverse left and right.
Using the rule well
Use the general wind over open water, corrected for your boat’s motion. Avoid sea breezes and wind bent by land. Hold a steady heading and allow for yaw, the boat swinging from side to side; do not mistake mast movement for cloud movement. Note the compass direction high or middle clouds come from. Low cloud largely follows surface wind. Treat the rule as a clue and check it against pressure and the latest bulletin.
Key figures
- Reliable front sign
- High cloud from upwind thickens and lowers; barometer falls
- First cirrus to rain
- Often about half a day to a day; varies a lot
- Halo
- A halo prompts cloud and pressure checks; no forecast on its own
- Crossed winds (north)
- Back to surface wind; high cloud from left: worse; from right: better
- Thunder warning
- Towering cumulus by late morning; altocumulus castellanus early
- Spanish terms
- Halo; cielo aborregado (mackerel sky); cúmulos de desarrollo
Remember
- A front is likely when high cloud thickens and lowers while the barometer falls.
- Halo and mackerel sky mean look again; they are not forecasts on their own.
- Towering cumulus by late morning warns of afternoon showers or thunder.
- North, back to the surface wind: high cloud from your left means worse weather.
- Use high or middle cloud and the open-sea wind for the crossed-winds rule.
Common mistakes
Wrong: Every halo means a gale within 12 hours.
Right: A halo is a prompt to watch. Check whether the cloud thickens and lowers and the barometer falls before drawing conclusions.
Wrong: Use low, fast-moving cloud for the crossed-winds rule.
Right: Low cloud moves almost with the surface wind. Use high or middle cloud, which shows the wind aloft.
Wrong: Apply the crossed-winds rule to a sea breeze near the coast.
Right: A sea breeze is a local wind. Use the general wind over open water, or the rule gives false answers.
Worked case
In the English Channel you have a steady westerly wind. With your back to it, you see cirrus streaks moving from your left, slowly thickening. The barometer has fallen 1.2 hPa in 3 hours. What do you expect, and what do you do?
Show the answer
With your back to a westerly you face east, so cloud from your left comes from the north. By the crossed-winds rule, high cloud from the left in the Northern Hemisphere means the weather will probably get worse. Thickening cirrus and a slow fall agree: a front may arrive within about a day. Get the latest forecast, plan your stops, and keep logging the sky and the barometer.
Practice question
Northern Hemisphere: your back is to the surface wind, and high clouds come from your right. What is most likely?
- The weather will improve
- The weather will get worse
- A sea breeze will start
- The wind will stay calm
Show the answer
Answer: A. By the crossed-winds rule, high cloud from your right in the Northern Hemisphere suggests improvement.
4 · Sea signs
Reading the sea: swell, period and a storm far away
New swell can arrive before its source storm. Log its direction, period and height; swell alone gives no storm distance or arrival time.

Swell runs ahead
Swell is waves that have left the wind that made them. Long swell travels a long way with little loss. So a new swell, from a direction unlike the local wind, can be the first sign of a distant storm. It comes from roughly where the storm was when it made those waves. Growing swell is a reason to check forecasts; it does not show that the storm is heading towards you.
Period
The period is the time between crests passing a point stationary relative to the water. If safe, stop making way through the water and drift clear of hazards. Time 11 crests at the same point on the hull: 10 intervals. Divide by 10. Boat motion through the waves changes this interval: it becomes an encounter period, not the period used below. Ten intervals in 140 seconds gives 14 seconds. Local wind waves often have periods under 8 seconds; distant swell often has periods of 12 seconds or more.
How fast it travels
In deep water, swell energy travels at a group speed of about 1.5 knots per second of period. A 14-second swell has a group speed of about 21 knots, roughly 500 nautical miles a day. Long periods arrive first. Over the next hours the period of a distant storm’s swell usually gets shorter, because shorter waves are slower and arrive later.
Worked example
A 14-second swell arrives from the south-west. Suppose its generating area was 800 nautical miles away when the waves formed. Its group speed is about 21 knots, so travel time is roughly 800 ÷ 21 ≈ 38 hours. That dates the waves, not the storm’s present position. Check the latest chart to see where the system is now.
Other sea signs
A cross sea, two wave trains from different directions, often follows a front or a sharp wind shift. Long swell breaking heavily on a coast, with little local wind, often arrives ahead of the weather. Watch more than the height: note its direction, period and height in your log every watch.
Key figures
- Period
- Seconds for 10 intervals ÷ 10 (time 11 crests)
- Deep-water swell group speed
- About 1.5 × period (s) knots
- 14-second swell
- Group speed about 21 knots, about 500 NM a day
- Distant-storm swell
- Often 12 s or more; local wind waves often under 8 s
- Spanish terms
- Mar de fondo (swell); mar de viento; periodo
Remember
- A new swell from an unusual direction can be the first sign of a distant storm.
- With no way through the water, time 11 crests (10 intervals), then divide the elapsed seconds by 10.
- Deep-water swell group speed is about 1.5 knots per second of period.
- Long periods arrive first; the period of a distant storm's swell then shortens.
- Log swell direction, period and height every watch.
Common mistakes
Wrong: Measure the period by timing two crests once.
Right: With no way through the water, time 11 crests, giving 10 intervals, and divide by 10. One interval is too short to be accurate.
Wrong: Swell always comes from the same direction as the local wind.
Right: Swell comes from where it was made. It can arrive from a quite different direction, often ahead of the storm.
Wrong: The swell arriving now shows where the storm is now.
Right: Its direction points towards where the waves formed. Use the latest chart for the storm’s present position.
Worked case
Drifting without making way in the Atlantic, you notice a long swell from the north-west that was not there yesterday. You time 10 intervals between crests in 150 seconds. The local wind is light from the south-east. What do you work out and do?
Show the answer
The period is 150 ÷ 10 = 15 seconds. Its deep-water group speed is about 1.5 × 15 ≈ 23 knots. Its period alone gives no distance or storm track. Get the latest high seas forecast or chart to check possible sources to the north-west. Log direction, period and height each watch; use the latest forecast and observations to decide how to prepare.
Practice question
Drifting without making way, you time 10 intervals between crests in 120 seconds. What is the period?
- 10 seconds
- 11 seconds
- 12 seconds
- 13 seconds
Show the answer
Answer: C. 120 ÷ 10 = 12 seconds. Time intervals, not crests: 11 crests give 10 intervals.
5 · Obs and forecast
Your observations, the forecast and the deck log
Compare the forecast with your observations. If they disagree, prepare for worsening weather while you get the latest bulletin and warnings.
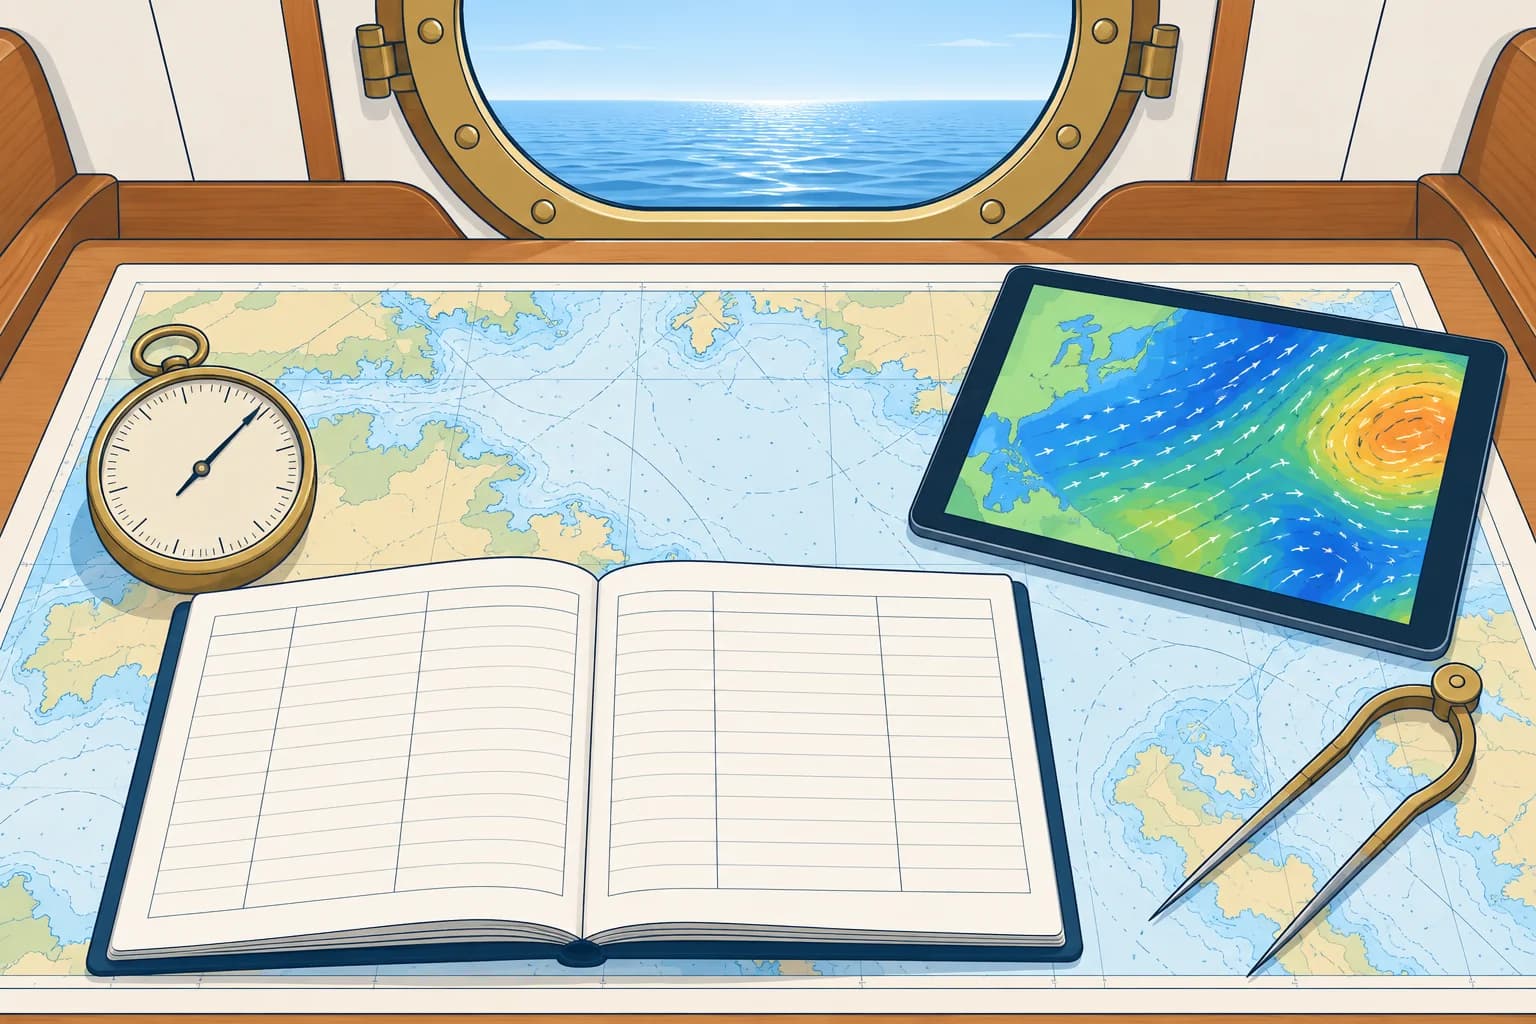
Two kinds of knowledge
An official forecast is made by forecasters using observations, satellites and computer models over a wide area. Forecast GRIB files usually carry computer-model guidance rather than a forecaster’s written bulletin; see GRIB and weather models. Your barometer, sky and sea show what is happening at your position now. For the next few hours, use local trends to test the forecast, especially if it was issued hours ago.
Test the forecast
Suppose the bulletin predicts a front at 1800, with thickening cloud, falling pressure and a backing wind (turning anticlockwise) beforehand. Write those expected changes and times in your log. Each watch, compare them with what you see. Matching observations support the forecast, but do not prove its timing.
When they disagree
If the barometer falls faster, or the wind shifts earlier, than the forecast suggests, check whether the system is deeper, faster or nearer. These signs do not prove the cause. Get the newest bulletin and warnings, and check the forecast’s issue time or the GRIB’s model run time. Until you know more, plan for the worst case: reef, seek shelter or keep sea room.
Limits of GRIB
Model wind represents conditions on a grid at forecast times. Output intervals are not the wind averaging period. Small-scale gusts, squalls and sharp fronts may be missed. Some forecast GRIBs include gust fields, but these can still underestimate extremes. Check available gust fields and read the official forecast and warnings alongside them.
Key figures
- Next few hours
- Use local trends to test the forecast over the next few hours
- Disagreement
- Get the newest bulletin; plan for the worst case meanwhile
- GRIB
- Model guidance; gust fields may still miss squalls
- Cloud cover
- In oktas: 0 = clear sky, 8 = overcast
- Log times
- UTC; pressure at least 3-hourly, hourly when falling
Keep a weather deck log
- Use fixed UTC times: pressure at least every 3 hours, hourly when falling; record other weather each watch. — Regular entries at known times give tendencies you can compare.
- Log position, barometer and its 3-hour tendency. — Pressure trends help you spot departures from the forecast.
- Log true wind direction and speed, and the largest gust seen. — Wind shifts and gusts show fronts and squalls arriving.
- Log wind waves and swell: direction, period and height. — A new or growing swell can warn of a distant storm.
- Log cloud type and cover in eighths (oktas), visibility and weather. — Regular entries help you recognise how the cloud is changing.
- Note the latest forecast received and what you expect next. — Comparing expectation and reality shows when the forecast is going wrong.
Remember
- Forecasts give the big picture; your observations show what is happening here.
- Turn each forecast into checks you can make each watch.
- Unexpected changes are a reason to update the forecast and prepare conservatively.
- GRIB mean wind and gust fields may miss extremes; check official forecasts and warnings.
- Log pressure, wind, sea, swell, cloud and visibility at fixed times in UTC.
Common mistakes
Wrong: The forecast says force 4, so the falling barometer must be wrong.
Right: Check the instrument, pressure trend and sky. A quick fall warrants updated information and preparation.
Wrong: A GRIB file showing 15 knots means the gusts will be about 15 knots.
Right: A 15-knot mean-wind field is not a gust forecast. Check gust fields and official warnings; squalls may be stronger.
Wrong: Keep the log only for position and course.
Right: Log the weather too. Without earlier entries you cannot spot the changes that warn you.
Worked case
Your 0600 forecast says a cold front will cross your area at about 2100. At 1500 the barometer has fallen 3.8 hPa in 3 hours, cloud has thickened, and the wind has backed and freshened earlier than you expected. The GRIB still shows 18 knots at 2100. What do you do?
Show the answer
These changes warrant checking whether the front is early or the low is deeper; they do not prove either. Get the newest bulletin and warnings, and check the GRIB’s model run time and available gust fields. Do not treat 18 knots as a gust limit: model fields can miss squalls. Reef, secure the deck, plan sea room or shelter for the front, and log hourly to track changes.
Practice question
Your barometer falls faster than the forecast suggests. What is the best first action?
- Ignore it until the next forecast is due
- Get the newest bulletin and warnings
- Reset the barometer to the forecast value
- Follow the GRIB because it is a newer model
Show the answer
Answer: B. A faster fall warrants updated information and preparation. Check the latest official bulletin and warnings, and plan for the worst case.