
Meteorology · Level R3 · 4 parts · about 13 min
Reading a synoptic chart: isobars, wind and the coming weather
4 short parts: The chart · Isobars and wind · Surface wind · Forecasting. Each part explains the idea, then gives the points to remember, the common mistakes, a worked case and a practice question; the Academy unit adds all 24 check questions.
1 · The chart
What a surface pressure chart shows
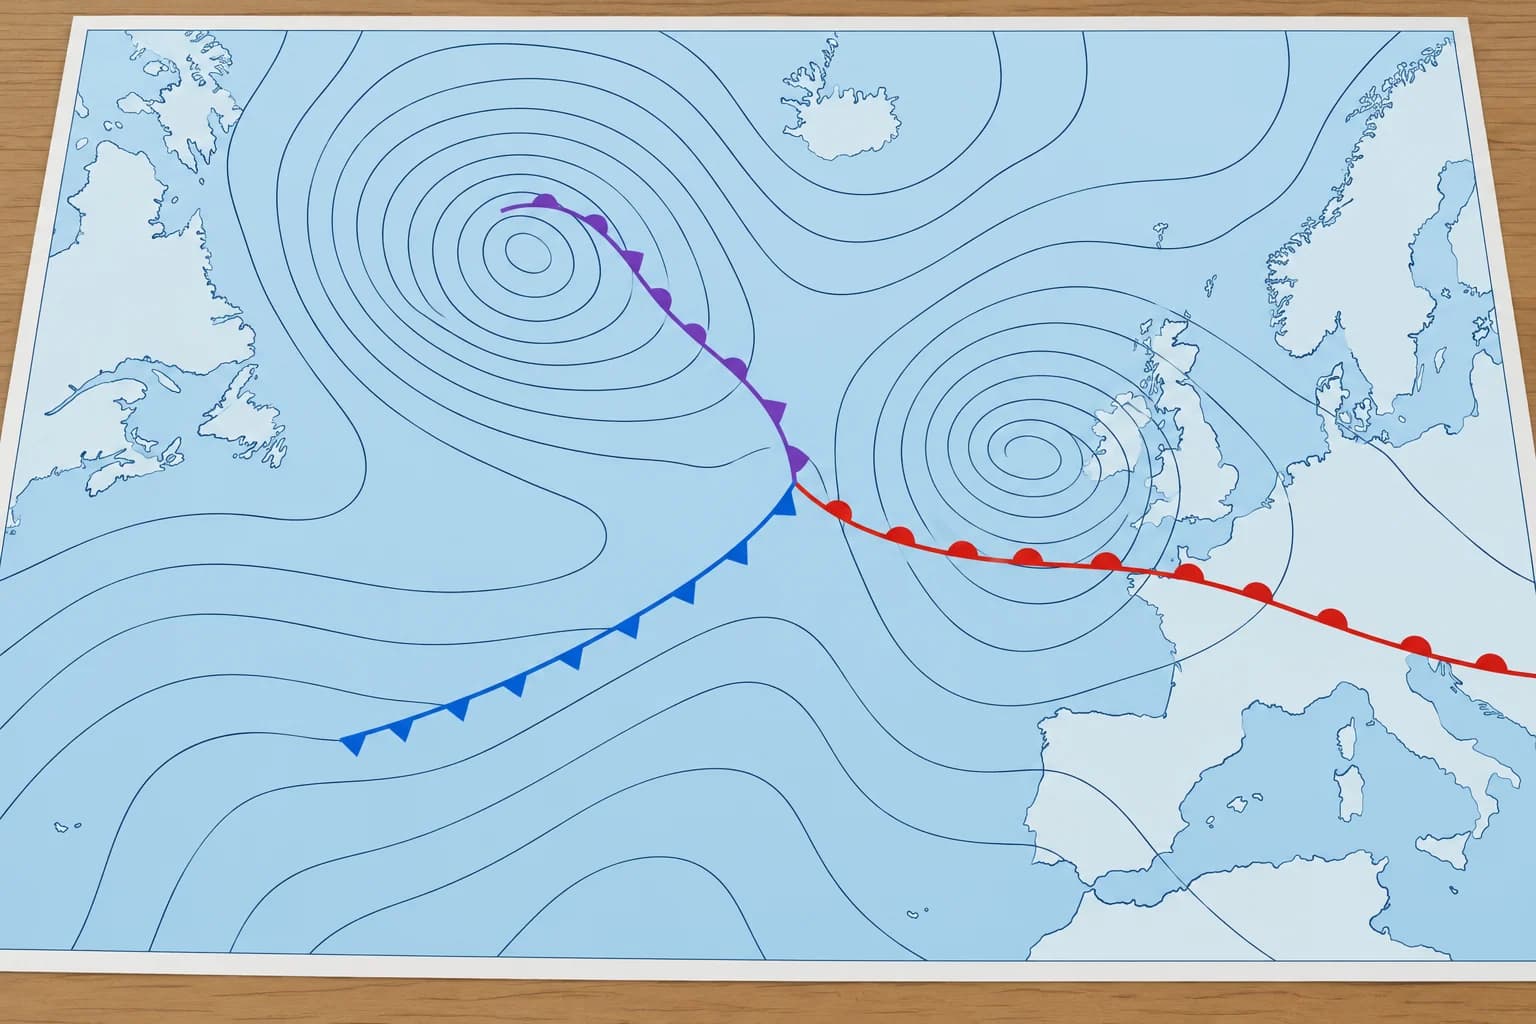
A synoptic chart maps pressure and fronts at one moment. Read its valid time, the isobars, the centres and the front symbols.
Analysis and forecast
A synoptic chart shows weather over a large area at one moment. An analysis shows the observed situation. A forecast chart (or prognostic chart) shows the expected situation later. T+24 means 24 hours after the chart's base time; the valid time tells you when the forecast applies. UTC is the common time reference, unaffected by local daylight saving. Check the valid time before reading the chart.
Isobars
Isobars are lines joining places of equal sea-level pressure. They are drawn at fixed steps, often every 4 or 5 hectopascals (hPa), and labelled in hPa. The pressure gradient is pressure change over distance. Close isobars generally mean stronger wind; wider spacing generally means lighter wind.
Centres
L (or T, D, B in some languages) marks a low and H (or A) a high, each with its central pressure. Closed isobars surround a low (a depression) or a high (an anticyclone).
Front symbols
A warm front has red semicircles; a cold front, blue triangles. An occluded front has both in purple on the same side. On moving fronts, symbols point towards the advance. A stationary front has alternating red semicircles and blue triangles on opposite sides, showing little or no movement. On monochrome charts, use the symbol shapes. Check the chart legend for trough lines.
Shapes to recognise
Isobars bulging out from a high form a ridge. Isobars bulging out from a low form a trough. A col is a saddle-shaped area between two opposing highs and two opposing lows. Practise on the Weather lab: synoptic charts, which lets you move the systems yourself.
Key figures
- Isobar interval
- Often 4 hPa; some services use 5 hPa
- Analysis chart
- The observed situation at its valid time
- Forecast chart
- Expected situation at T+24, T+48… from its base time
- Warm / cold front
- Red semicircles / blue triangles, pointing the way it moves
- Occluded front
- Purple semicircles and triangles on the same side
Remember
- Check the valid time and whether it is an analysis or a forecast.
- Isobars join equal pressure, often every 4 hPa.
- Close isobars mean strong wind; wide spacing means light wind.
- Moving-front symbols indicate direction; stationary-front symbols lie on opposite sides.
- Recognise ridges, troughs and cols from the isobar shapes.
Common mistakes
Wrong: A chart shows the weather for the whole day.
Right: Each chart shows one moment, its valid time. Compare charts for successive times to see the change.
Wrong: Isobars show where it is raining.
Right: Isobars show pressure only. Rain is linked to fronts, troughs and showers, not to the isobars themselves.
Worked case
You download a chart labelled "T+48, valid 12 UTC Saturday" on Thursday morning. It shows a cold front with blue triangles pointing east, 200 nautical miles west of your harbour. How do you use it?
Show the answer
It is a forecast chart for midday UTC on Saturday, not the present situation. It suggests a cold front approaching from the west at that time. Use it to plan, then check the newer charts and the official forecast on Friday and Saturday: front timing often changes by several hours.
Practice question
At the chart’s valid time, A has 1012 hPa and B has 1016 hPa. Can they lie on the same isobar?
- Yes, if both are offshore
- No, their pressures differ
- Yes, if both are near a low
- Only on a forecast chart
Show the answer
Answer: B. No. An isobar joins places with equal sea-level pressure at one time. At the chart’s valid time, A and B have different pressures.
2 · Isobars and wind
Geostrophic wind: speed from isobar spacing
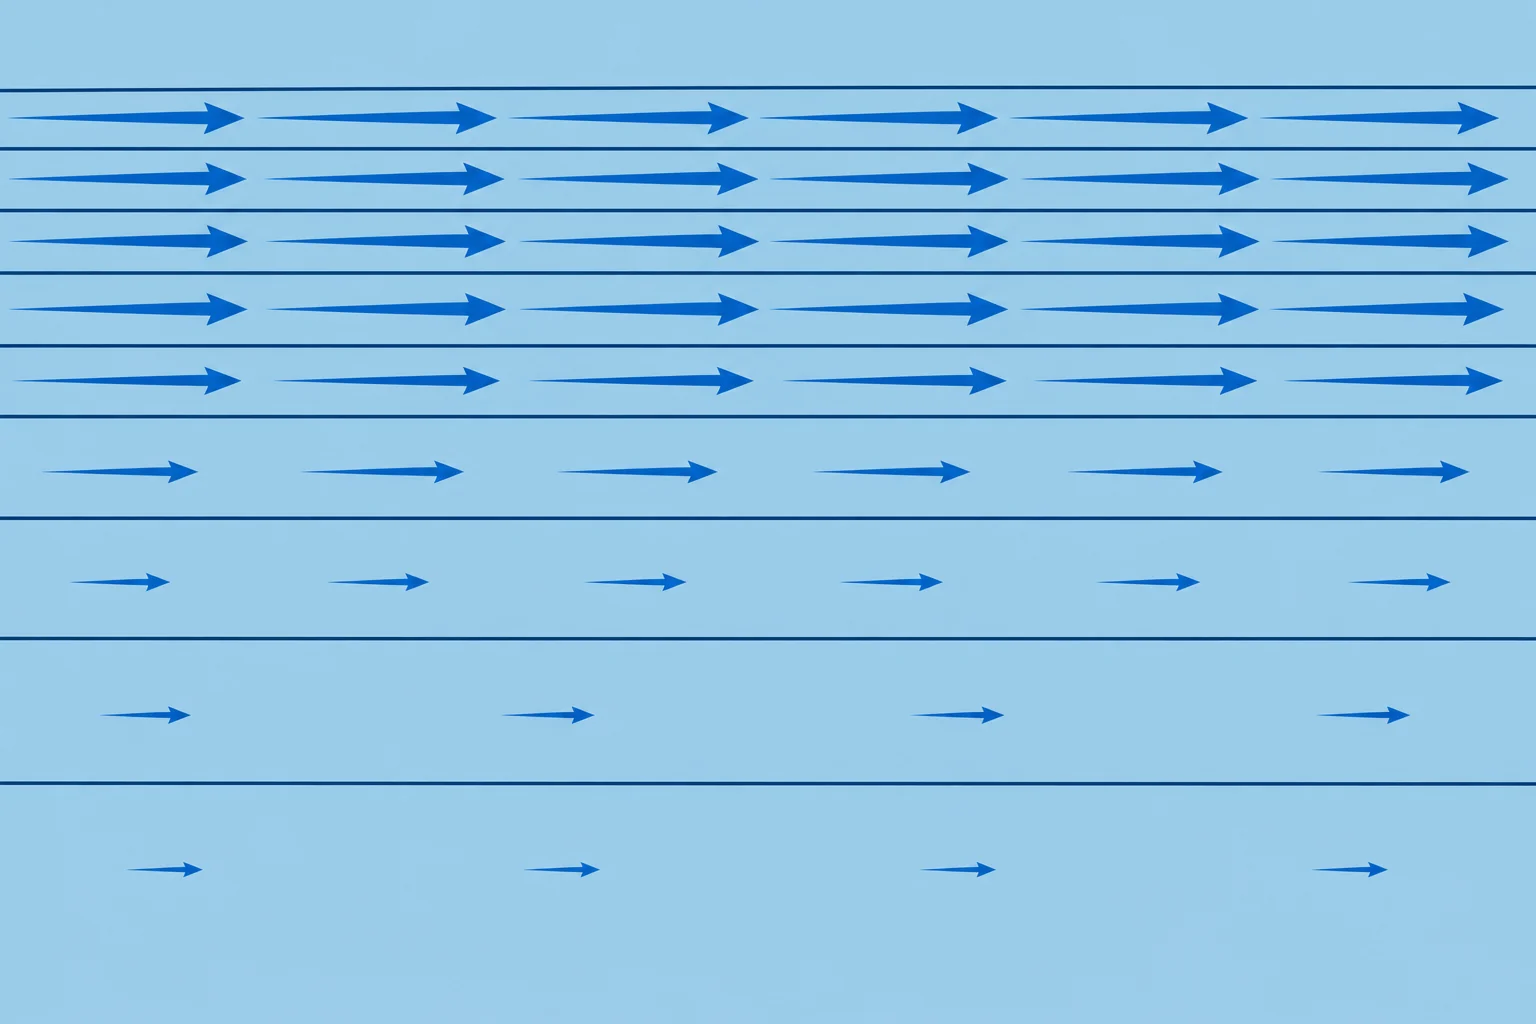
Above surface friction, wind follows nearly straight isobars. Its speed grows with a tighter pressure gradient and, for the same gradient, at lower latitude.
Two forces in balance
The pressure gradient force pushes air from high to low pressure. The Coriolis effect of the Earth's rotation turns moving air to the right in the Northern Hemisphere. Above the friction layer, these forces approximately balance in steady flow along straight or gently curved isobars. This gives the geostrophic wind.
Spacing gives speed
Closer isobars mean stronger geostrophic wind. Halve the spacing and the wind doubles. Measure perpendicular to adjacent isobars: the shortest gap. Use the chart's geostrophic scale for your latitude and its stated pressure interval; do not use a 4 hPa scale directly for 5 hPa spacing.
Latitude matters
The Coriolis effect weakens towards the equator. For the same pressure gradient, wind is stronger at lower latitudes. Near the equator, below about 15°, the geostrophic rule becomes unreliable.
A worked example
At 50°N, isobars 4 hPa apart and 100 nautical miles (NM) apart give a geostrophic wind of about 30 knots. At 40°N, the same spacing gives about 37 knots. If the isobars close to 50 NM apart at 50°N, the wind doubles to about 60 knots.
Curved isobars
Gradient wind follows curved isobars above surface friction. For the same pressure gradient, it is slower than geostrophic around a low and faster around a high. Cyclostrophic wind balances the pressure force with the outward effect of a tight turn. Euler wind accelerates under the pressure force alone. Antitriptic wind balances the pressure force with friction. These last three names appear in Spanish syllabuses.
Key figures
- Geostrophic wind
- Along nearly straight isobars, above the surface friction layer
- Scale check
- Match latitude and isobar interval; measure perpendicular spacing
- Example at 50°N
- 4 hPa per 100 NM ≈ 30 knots
- Example at 40°N
- 4 hPa per 100 NM ≈ 37 knots
- Half the spacing
- Twice the geostrophic wind
- Curvature
- Gradient wind, same gradient: slower round a low; faster round a high
Remember
- Geostrophic wind blows along nearly straight isobars above the friction layer.
- Closer isobars mean stronger wind: half the spacing, double the wind.
- The same spacing gives stronger wind at lower latitude.
- Match the geostrophic scale to latitude and pressure interval; measure perpendicular to adjacent isobars.
- For the same pressure gradient, gradient wind is slower round a low and faster round a high than geostrophic wind.
Common mistakes
Wrong: The same isobar spacing always means the same wind.
Right: The wind depends on latitude too. The same spacing gives more wind in the Mediterranean than off Scotland.
Wrong: The geostrophic wind is the wind you will feel on deck.
Right: It is the wind above the friction layer. At sea level it is lighter and turned towards the low.
Worked case
Two areas have 4 hPa isobars. The chart scale gives 33 knots for 100 NM at 45°N and 35 knots for 100 NM at 43°N. Actual spacing is 100 NM in Biscay (45°N), but 50 NM off Galicia (43°N). Compare the geostrophic winds. Can you use these as deck winds?
Show the answer
About 33 knots in Biscay and 70 knots off Galicia: halving the gap doubles Galicia's 35-knot reading. These are winds above surface friction. You still need a surface correction before estimating deck wind.
Practice question
Which two forces balance to give the geostrophic wind?
- Friction and the pull of gravity on air
- The pressure force and the Coriolis effect
- Friction and the centrifugal force of a turn
- The sea breeze and the land breeze together
Show the answer
Answer: B. In steady flow above the friction layer, the pressure gradient force and the Coriolis effect approximately balance along nearly straight isobars.
3 · Surface wind
Surface wind: friction, veer and back
Friction slows surface wind and turns it towards low pressure: backed in the Northern Hemisphere, veered in the Southern Hemisphere.

Friction slows and turns
Near the surface, friction slows the wind. The Coriolis effect weakens with it, so the wind crosses the isobars towards low pressure. Backing means the direction the wind comes from changes anticlockwise; veering means clockwise. Compared with the geostrophic wind, surface wind is backed in the Northern Hemisphere (NH) and veered in the Southern Hemisphere (SH).
Over the sea
The sea is smooth, so friction is relatively small. In the Northern Hemisphere, surface wind over the open sea is backed about 10–20° and has about two-thirds to three-quarters of the geostrophic speed. Over land, friction is greater: backed about 30° or more and often only half the speed.
Stability changes it
In unstable air, such as cold air over a warmer sea, mixing brings down fast air from above: the surface wind is stronger and gusty, with a smaller turning angle towards low pressure. In stable air, such as warm air over a colder sea, the surface wind is lighter, with a larger turning angle, but it can stay strong just above the mast.
Worked example (Northern Hemisphere)
The chart gives a geostrophic wind of 30 knots from 270°. Over the open sea, expect about 20–23 knots, force 5 to 6, from about 250–260°. Stable air can reduce the surface wind further. Coastal effects can strengthen or weaken it; shower gusts may approach 30 knots.
Crossing the coast (Northern Hemisphere)
Wind leaving land meets less friction: it veers and strengthens over the sea. Wind blowing onto land backs and weakens. With your back to a wind blowing along a coast, land on your right squeezes the flow together: stronger wind near shore. Land on your left spreads it apart: lighter wind. Squeezing together is convergence; spreading apart is divergence.
Key figures
- Over sea (NH)
- Backed ~10–20°; about 2/3 to 3/4 of geostrophic speed
- Over land (NH)
- Backed ~30° or more; often about half the speed
- Southern Hemisphere
- Surface wind veered from geostrophic, not backed
- Example (NH)
- Geostrophic 270°/30 kn → sea surface ~255°, 20–23 kn
- Offshore wind leaving land (NH)
- Veers and strengthens over the sea
- Along a coast (NH)
- Back to wind, land on right: stronger; land on left: lighter
Remember
- Friction turns the surface wind towards the low.
- Northern Hemisphere: surface wind is backed; Southern: veered.
- Over the sea (NH): backed about 10–20°, about two-thirds to three-quarters of geostrophic speed.
- Unstable air: stronger and gusty; stable air: lighter at the surface.
- Wind leaving the land veers and strengthens over the sea (NH).
Common mistakes
Wrong: The surface wind over the sea equals the geostrophic wind from the chart.
Right: Reduce it to about two-thirds to three-quarters and back it 10–20° (NH). Then allow for gusts.
Wrong: Friction backs the wind in both hemispheres.
Right: Friction turns the wind towards the low. That is backing in the north and veering in the south.
Wrong: A calm harbour means calm at sea.
Right: Shelter can change both wind speed and direction in a harbour. Estimate open-sea wind from the chart and official forecast.
Worked case
The chart over the Gulf of Lion shows a geostrophic wind of 45 knots from 320°. The air is cold and flowing over a warmer sea. What surface wind do you expect at sea?
Show the answer
The standard correction gives about 30–34 knots, force 7–8, from 300–310°. Cold air over a warmer sea promotes mixing, so the mean may be stronger and less backed: closer to 320°. Gusts can reach or exceed 45 knots; the chart alone cannot predict them. Check the official wind and gust forecast.
Practice question
In the Northern Hemisphere, how does surface friction change the direction of the wind?
- It veers the wind away from the low
- It backs the wind towards the low
- It turns the wind straight along the isobars
- It reverses the wind after sunset
Show the answer
Answer: B. Friction turns the surface wind towards the low. In the Northern Hemisphere that is backing.
4 · Forecasting
Forecasting from a chart
Read the wind at your position, then compare successive charts to see which systems are approaching and when.
Your wind now
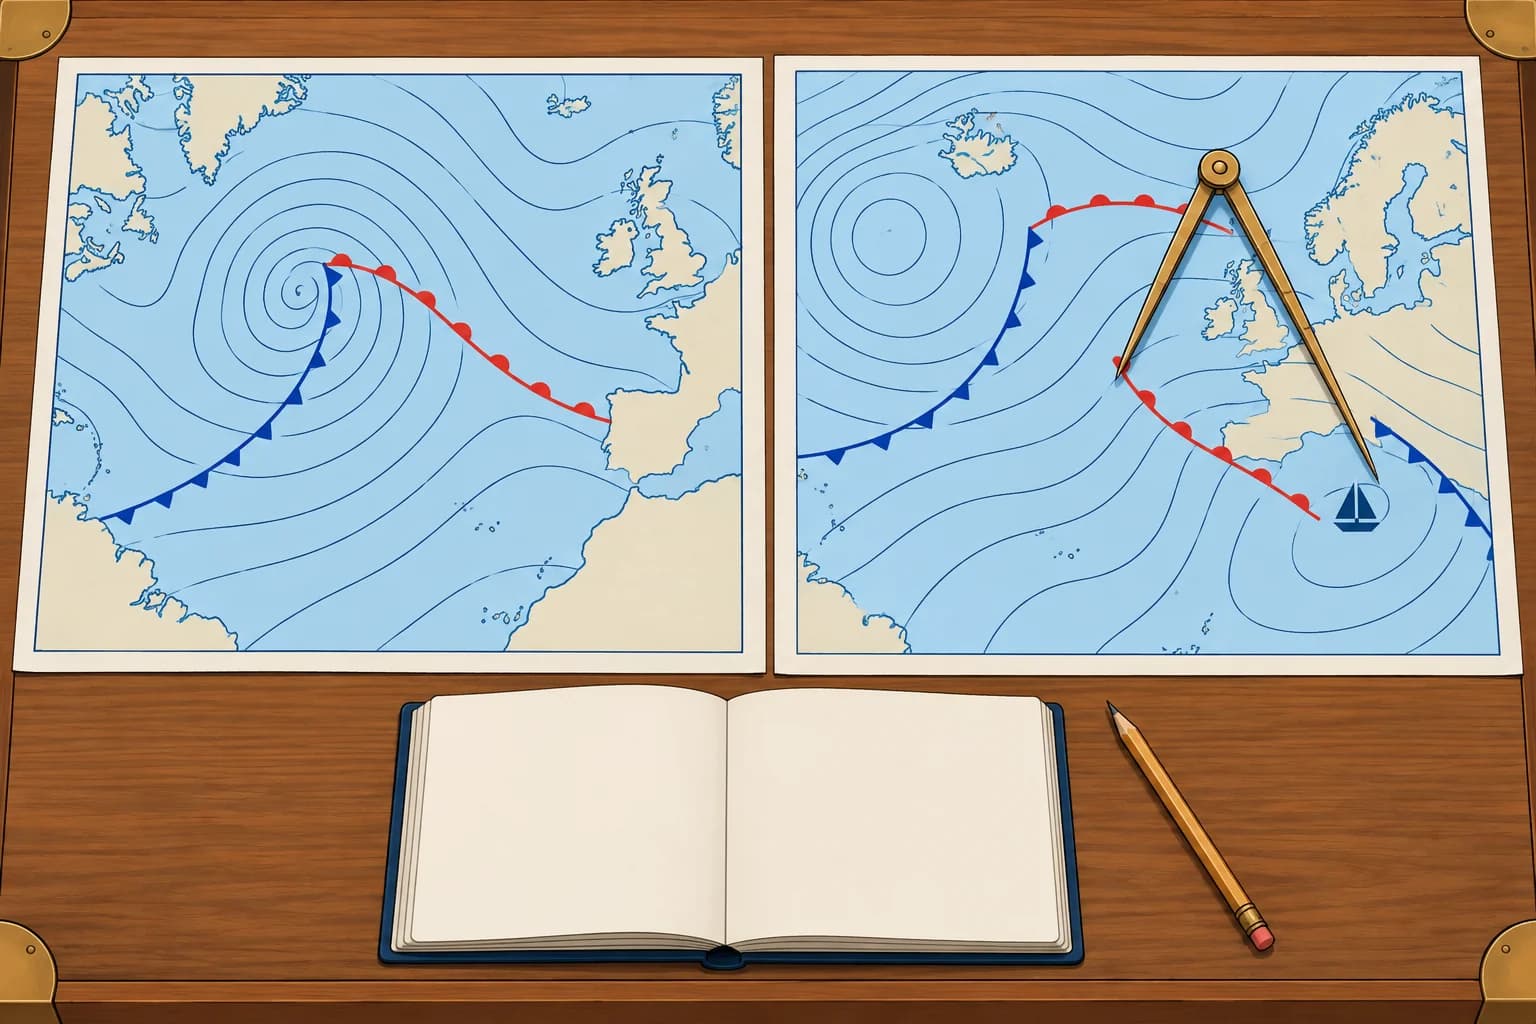
Put your position on the chart. In the Northern Hemisphere, wind above surface friction blows along the isobars with low pressure on your left, with your back to the wind. Back it 10–20° for the sea surface. Estimate speed from the spacing or geostrophic scale, then reduce it to about two-thirds to three-quarters. Near tightly curved isobars, this simple conversion is less reliable; check the official wind forecast.
What is coming
Scan upwind, but do not assume systems follow your surface wind. Mid-latitude systems often move eastwards. Compare successive forecast charts at their valid times to establish the tracks of lows, fronts and troughs. Note whether a low’s central pressure falls (deepening) or rises (filling), and whether nearby isobars tighten.
Timing
For a fixed position, measure distance along the front's approach track; nautical miles (NM) divided by its approach speed in knots gives hours. Compare positions and valid times on successive charts to estimate that speed. A front 120 NM away approaching at 20 knots arrives in about 6 hours. Treat this as a rough guide: fronts speed up, slow down or stall.
Expected changes
For a typical frontal low moving east in the Northern Hemisphere, passing north of you with both fronts crossing your position, wind often backs ahead of the warm front and veers at each front. A track south usually brings backing overall. These are guides: check the actual front positions and isobars. Tightening isobars suggest strengthening wind; a weak-gradient ridge usually brings lighter wind.
Check it
Compare your chart reading with the official forecast, the barometer trend and the sky. If they disagree, check updated charts and forecasts before trusting your estimate.
Key figures
- Arrival time
- Distance along approach track (NM) ÷ approach speed (kn) = hours
- Example
- Front 120 NM away approaching at 20 kn → about 6 hours
- Typical east-moving frontal low north (NH)
- Both fronts cross you: often backs ahead, then veers at each front
- Typical east-moving frontal low south (NH)
- Usually backing overall; check actual front positions and isobars
- Tightening isobars
- Wind increasing
Reading the next 24 hours from forecast charts
- Check the valid time of each chart and put them in order. — Each chart is one moment; the order shows the movement.
- Mark your position on each chart. — Use the same position to track local weather changes over time.
- Read wind direction and speed from the isobars, then back and reduce it for the sea surface (NH). — The scale gives a geostrophic estimate; tight curvature changes it.
- Follow each low, high and front from chart to chart and estimate its speed. — Distance along a front's approach track ÷ its approach speed gives a rough arrival time.
- Predict the wind shifts: veer or back, and where isobars tighten. — This shows how wind direction and strength may change at your position.
- Cross-check your chart reading against the official forecast, barometer trend and sky. — Differences show where your estimate needs checking against updated information.
Remember
- Read your local wind, then compare successive charts to track systems and changes in their central pressure.
- Distance along the approach track ÷ approach speed gives a rough front arrival time.
- Typical east-moving frontal low north (NH), both fronts crossing: often backs ahead, then veers at each front.
- Check the chart against the forecast, barometer and sky.
Common mistakes
Wrong: Your surface wind tells you where approaching systems come from.
Right: Local airflow and system movement can differ. Compare system positions on successive charts at their valid times.
Wrong: A front's arrival time from a chart is exact.
Right: Fronts speed up, slow down and stall. Allow several hours either way and keep checking.
Worked case
At 0600 UTC in the Northern Hemisphere, an active north–south cold front is 150 NM west of you, moving east. The chart valid at 1800 UTC puts it 30 NM west. Ahead, isobars run SW–NE with low pressure to the NW and are tightening. Estimate its arrival and likely wind changes.
Show the answer
It moves 120 NM in 12 hours: 10 knots. At that speed it reaches you about 2100 UTC, though timing can change. Expect a strengthening wind from roughly south-south-west to south-west ahead, then a veer towards west to north-west with a typical cold-front passage. Squalls and rain are possible, with rising pressure and showers behind. Cross-check the official forecast, barometer and sky.
Practice question
A front is 90 NM away along its approach track, approaching at 15 knots. When will it arrive?
- In about 3 hours
- In about 6 hours
- In about 9 hours
- In about 15 hours
Show the answer
Answer: B. 90 ÷ 15 = 6 hours. Treat it as a guide: fronts change speed.