
Ship stability and stowage · Level P4 · 5 parts · about 17 min
Damage stability calculations, longitudinal strength and the draught survey
5 short parts: Damage rules · Damage on board · Hull strength · Draught survey · Survey example. Each part explains the idea, then gives the points to remember, the common mistakes, a worked case and a practice question; the Academy unit adds all 30 check questions.
1 · Damage rules
Damage stability rules: deterministic and probabilistic
SOLAS II-1 Part B-1 judges subdivision by the probability of surviving a collision. Learn what A ≥ R and the p, s and v factors mean for you as master.
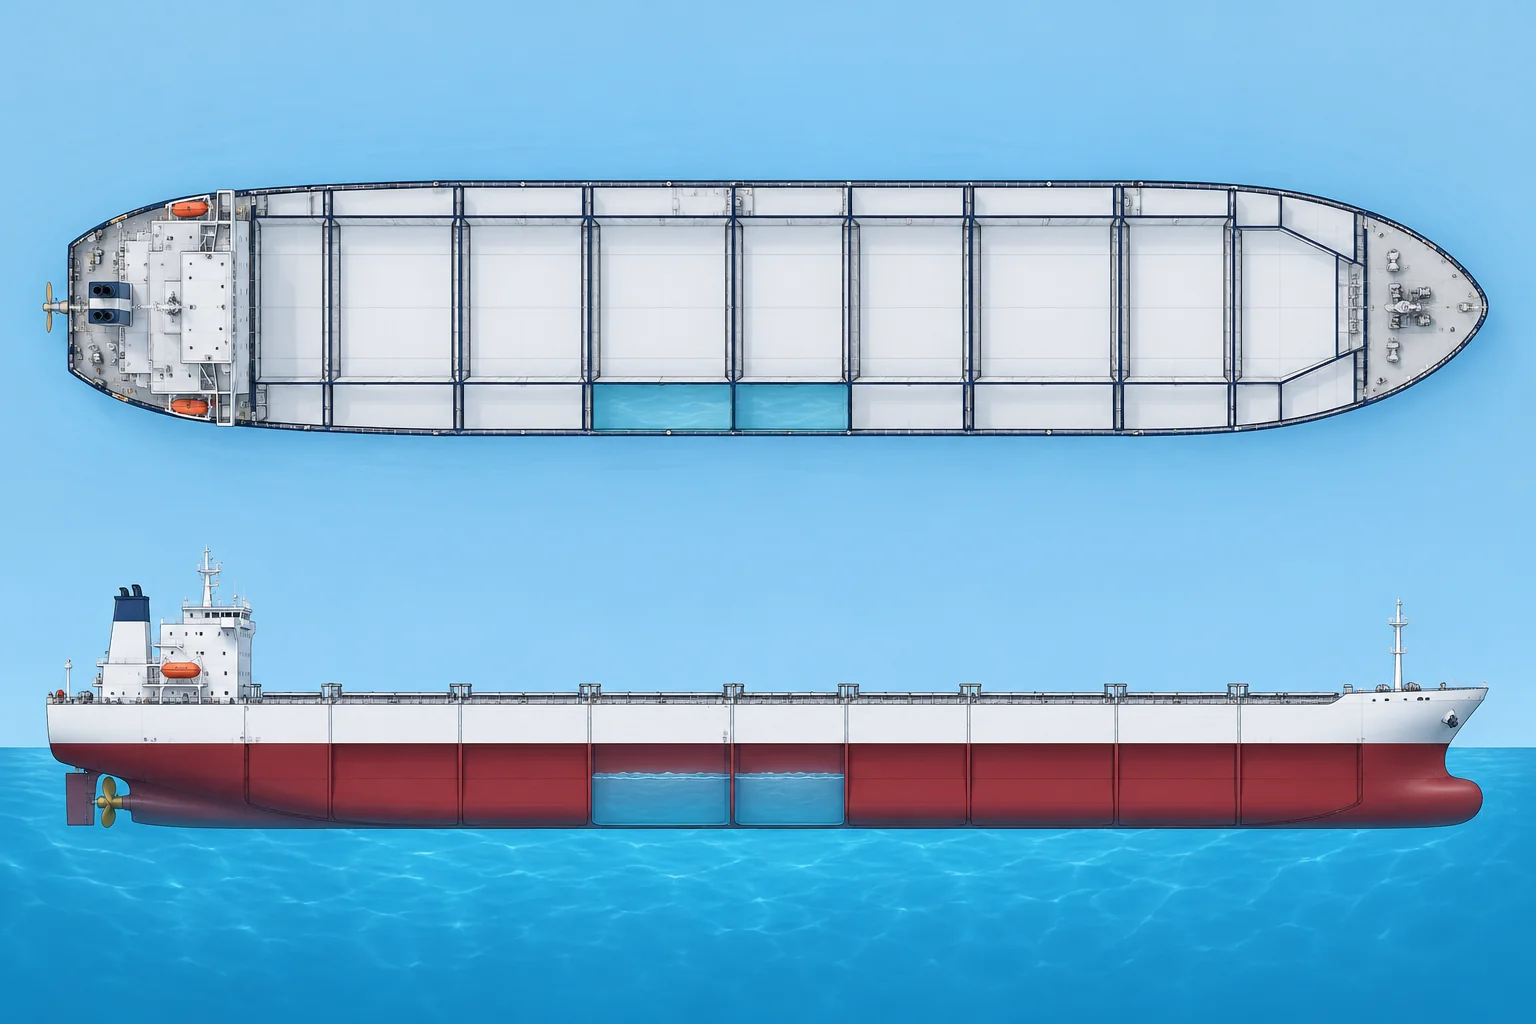
Two approaches
A deterministic rule assumes set damage and requires the ship to survive it. MARPOL, IBC/IGC and reduced-freeboard Load Line rules use this approach. SOLAS II-1 Part B-1 is probabilistic: it estimates the chance of surviving a random collision. For ships built from 1 January 2009, the harmonised rules generally cover passenger ships and cargo ships 80 m and over, with specified alternative-rule exemptions.
The attained index A
For each compartment or group of adjacent compartments, the p factor is the probability that damage opens only that group, taken from damage statistics. The s factor is the probability she survives that flooding without capsizing or heeling dangerously. A v factor within s allows for watertight decks: the chance the damage stays below one. Each index is the sum of p × s over all damage cases.
Three draughts
Use three draughts: ds, the summer load-line draught; dl, the lightest expected service condition, including necessary ballast and, on passenger ships, all passengers and crew; and dp = dl + 0.6 × (ds − dl). Light service does not mean lightship. Combine their partial indices as A = 0.4As + 0.4Ap + 0.2Al. The approved minimum-GM curve uses the assessed GMs and trims and also accounts for intact stability.
The required index R
Compliance is A ≥ R. For cargo ships over 100 m, R = 1 − 128 ÷ (Ls + 152), where Ls is the subdivision length. Each partial index must also reach 0.5 R for cargo ships and 0.9 R for passenger ships. Since 2020, passenger ship R depends on the persons on board: 0.722 below 400, and higher above.
The s factor in practice
In final equilibrium, a larger remaining righting lever GZmax and wider positive-GZ range increase s until its calculation caps are reached: 0.12 m and 16°, or 0.20 m and 20° for ro-ro passenger ship damage involving a ro-ro space. These are calculation caps, not maximum permitted GZ or range. Heel reduces s above 25° on cargo ships (zero at 30°) and 7° on passenger ships (zero at 15°). Intermediate flooding and downflooding can govern. Use the approved minimum-GM curve.
Key figures
- Compliance
- A ≥ R; partial indices ≥ 0.5R (cargo), ≥ 0.9R (passenger)
- Attained index
- A = 0.4 As + 0.4 Ap + 0.2 Al
- Each partial index
- Sum of p × s over all damage cases
- R, cargo ships > 100 m
- R = 1 − 128 ÷ (Ls + 152)
- Partial draught dp
- dl + 0.6 × (ds − dl)
- s = 0 (final stage)
- Heel ≥ 30° cargo ships; ≥ 15° passenger ships
Remember
- Deterministic rules assume specified damage; SOLAS II-1 Part B-1 is probabilistic.
- p = chance of that damage, s = chance of surviving it, v = effect of watertight decks.
- A = 0.4 As + 0.4 Ap + 0.2 Al must reach R, each partial index ≥ 0.5 R on cargo ships.
- The GM limit curve comes from the GMs assumed at ds, dp and dl.
Common mistakes
Wrong: A ≥ R means she survives any two-compartment damage.
Right: A is a probability-weighted index. Some damage cases, even involving one compartment, may still sink the ship.
Wrong: Sailing below the minimum GM is fine if the intact criteria are met.
Right: The minimum GM curve combines intact and damage requirements. Below it, the A ≥ R result no longer holds.
Worked case
A bulk carrier with a subdivision length of 200 m has partial indices As 0.30, Ap 0.90 and Al 0.90. Can departure be approved from these results?
Show the answer
No. R = 1 − 128 ÷ (200 + 152) = 0.636 and A = 0.4 × 0.30 + 0.4 × 0.90 + 0.2 × 0.90 = 0.660, so the combined index passes. But each cargo partial index must reach 0.5R = 0.318. As is only 0.30. Passing A alone is insufficient.
Practice question
What does the p factor represent?
- The chance she survives the resulting flooding
- The chance that damage opens just that group
- The permeability assumed for those spaces
- The share of the ship’s length damaged
Show the answer
Answer: B. p is the probability that only that compartment or group is flooded. Survival is the s factor; permeability is a separate input.
2 · Damage on board
Damage control information, flooding tools and countermeasures
After a collision or grounding you need the damage control plan, a reliable stability tool and clear countermeasures, in that order.
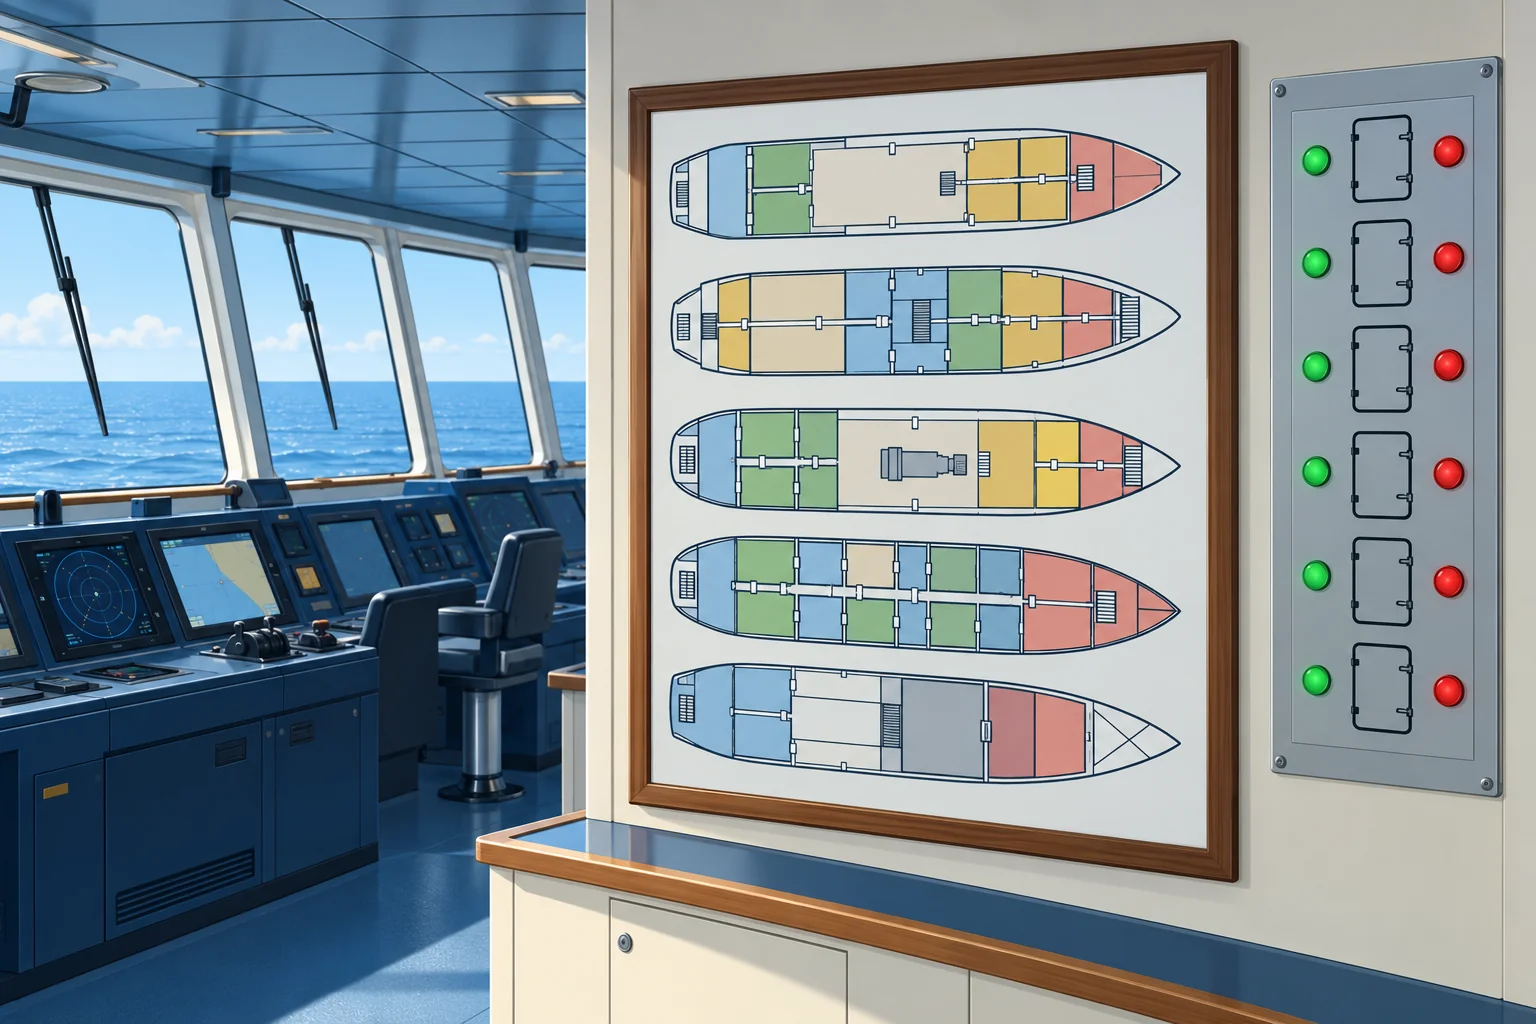
Damage control plan
SOLAS II-1/19 requires plans, permanently exhibited or readily available on the bridge, showing for each deck and hold the watertight boundaries, the openings with their means of closure and control positions, and the arrangements for correcting a list due to flooding. Booklets with the same information go to the officers, with the precautions vital to watertight integrity.
Damage stability information
For ships under Part B-1, damage stability information gives you a simple way to judge survivability for damage to any compartment or group. A booklet gives pre-calculated cases. Under IACS UR L5, Type 3 calculates pre-programmed damage cases for the loading condition; Type 4 assesses actual flooding. Passenger ships covered by SOLAS II-1/8-1 must have an onboard stability computer or shore-based support; check the provisions applicable to your ship.
First assessment
Repeat soundings in damaged and neighbouring spaces and compare them with heel and draughts. A steady level may mean equilibrium with the sea; rising levels may reflect inflow or changing heel or trim. Rising water in a previously dry adjacent space at unchanged heel and trim indicates progressive flooding. Close the watertight doors, hatches, vents and valves shown on the plan. Use a matching approved damage case or actual-flooding tool to check GZ, heel and downflooding margin.
Countermeasures
List is a lean from unequal weight or buoyancy; loll is an equilibrium heel with negative upright GM. Both can coexist. Pumping or transferring liquids can worsen stability. Check each stage for residual GZ, free surface and downflooding. With confirmed loll, lower G; fill a low, divided tank on the low side only if the approved damage assessment supports every stage. Counter-flooding adds water to reduce asymmetric heel, consuming reserve buoyancy. Cross-flooding equalises flooding between sides; use the approved arrangements.
Help ashore
Shore-based emergency response services, run by class societies, can model damage with your ship’s hull data. Enrol beforehand; keep soundings, draughts and damage details ready. Notify the coastal state. Passenger-ship drills rehearse assessment, closures, equipment and stability information at least every three months. Each drill establishes the ship–shore communications link if support is provided. At least annually, activate that support to assess simulated damage.
Key figures
- SOLAS II-1/19
- Damage control plans on the bridge; booklets for officers
- The plan shows
- Watertight boundaries, openings, closures, list correction
- IACS UR L5 Type 3
- Intact stability plus pre-programmed damage cases
- SOLAS II-1/8-1
- Applicable passenger ships: onboard computer or shore support
- SOLAS II-1/19-1
- Passenger ships: damage control drill every three months
After damage: the first hour
- Sound the alarm, muster, and close the watertight doors and openings on the damage control plan. — Keeps the flooding to the damaged compartments.
- Sound all tanks and voids near the damage and repeat the soundings regularly. — Repeated soundings help track flooding; compare them with adjacent spaces, draughts and heel.
- Read the draughts forward, aft and amidships, and the list. — Gives the real condition to compare with the calculation.
- Use a Type 4 tool for actual flooding, or verify that a pre-programmed Type 3/booklet case matches the damage. — Shows heel, GZ and the margin to downflooding.
- Assess each proposed countermeasure through its intermediate stages before acting. — Reducing heel alone does not prove that residual stability and buoyancy improve.
- Call the shore-based emergency response service and report to the coastal state. — An independent calculation and early help.
Remember
- Use the damage control plan to close boundaries before you calculate.
- Compare repeated soundings with heel and draughts; a steady level alone does not prove containment.
- List and loll can coexist; assess every stage before pumping, transferring or adding liquid.
- Enrol in a shore-based emergency response service before you need it.
Common mistakes
Wrong: Correct any list at once by filling a tank on the high side.
Right: List and loll can coexist. With negative upright GM, filling the high side can cause a sudden roll. Check each stage before acting.
Wrong: One sounding after the damage is enough.
Right: Repeat soundings in damaged and adjacent spaces. A steady level may mean equilibrium with the sea, not containment. At unchanged heel and trim, rising levels in previously dry adjacent spaces indicate progressive flooding.
Worked case
After a grounding your ship lists 6° to port. Soundings show No. 2 port double bottom flooded, with a steady level. The starboard double bottom tanks are empty. The second officer wants to pump fuel into them. What do you check first?
Show the answer
Do not infer GM from the tank’s position; asymmetric flooding and loll can coexist. Check the actual condition and each transfer stage, including the source tank, free surface, GZ, heel, downflooding, draughts and hull loads. Positive GM alone does not prove safety. Transfer only if the approved assessment shows safe improvement, using tanks approved for fuel. Establish whether she is still aground, seek shore support and keep sounding No. 2 port and adjacent spaces.
Practice question
A damaged compartment has several openings. Where do you find their closures and control positions?
- On the damage control plan
- On the fire control plan
- On the general cargo plan
- On the lifesaving plan
Show the answer
Answer: A. The damage control plan identifies watertight boundaries, openings, closures and control positions. Use it to locate the closures for the damaged compartment.
3 · Hull strength
Managing longitudinal strength at management level
As chief mate or master you plan sequences that keep stresses low throughout, watch them during cargo work, and protect the hull from fatigue over its life.
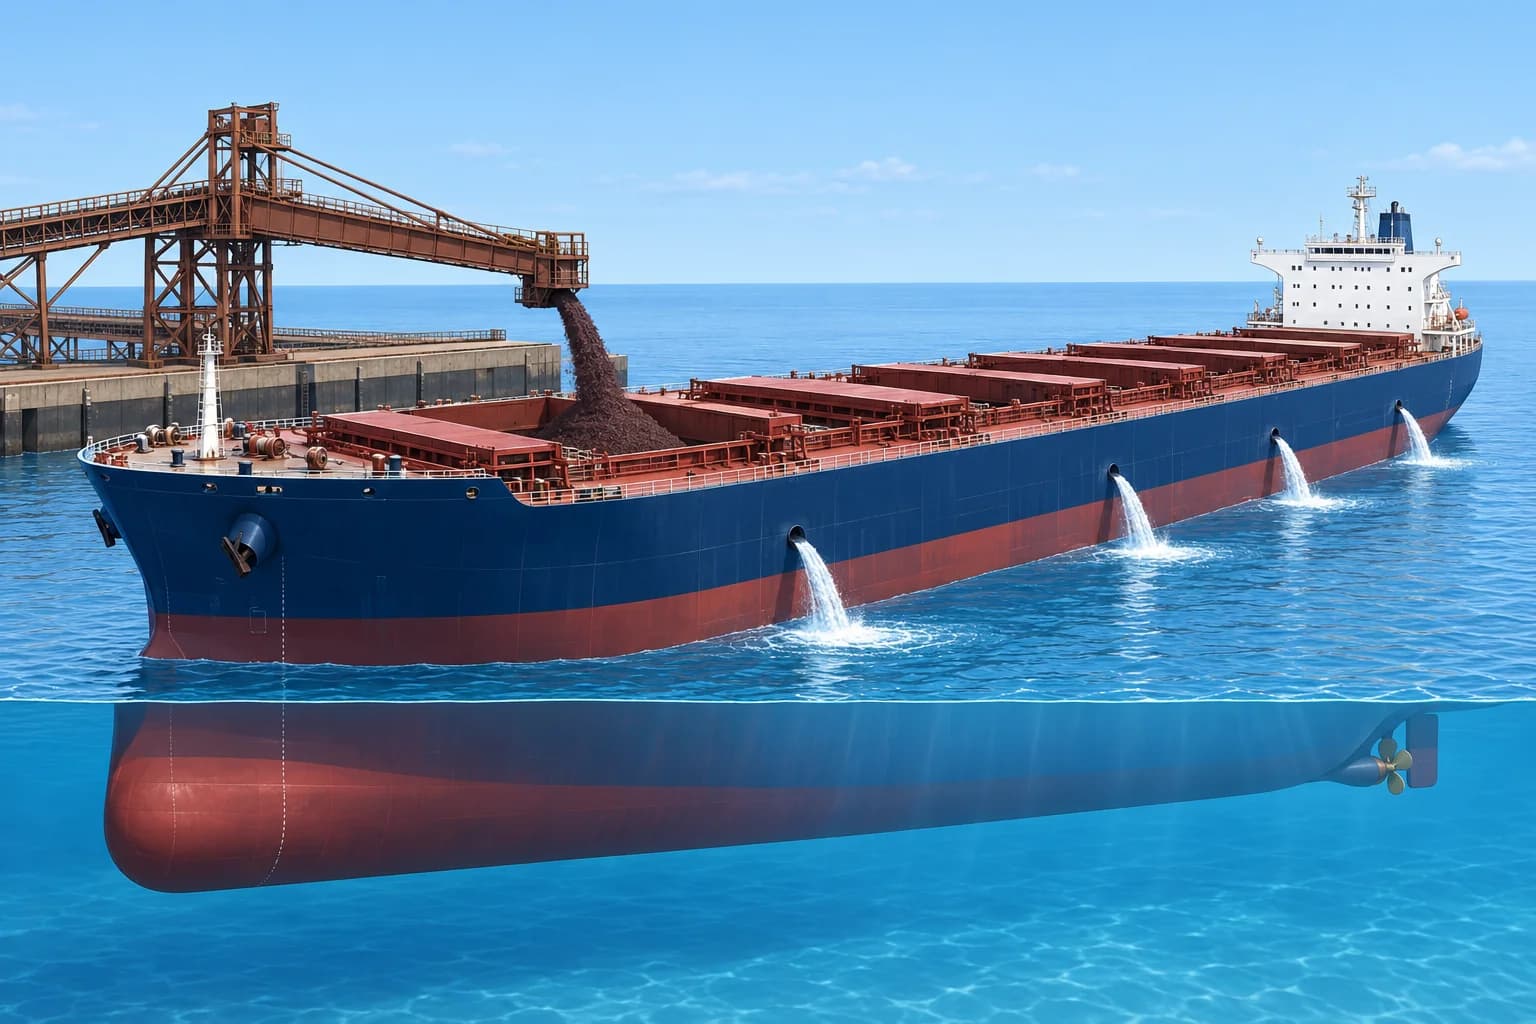
Rules behind the limits
Class rules, harmonised by IACS UR S11, set the strength of the hull girder. The permissible still water SF and BM in your loading manual come from them, with wave loads already allowed for. IACS UR S1 sets what the loading manual and loading instrument must contain. Bulk carriers and oil tankers built to the IACS Common Structural Rules follow the same idea.
Sequences, not snapshots
Plan every pour, discharge step and ballast change. Cargo can arrive faster than ballast can be discharged. Check every stage against applicable approved limits. Use harbour limits only where the loading manual permits them for the sheltered-water condition; otherwise use the applicable seagoing limits. Check the final condition against seagoing limits. Avoid a heavy hold next to an empty one unless the loading manual approves that pattern.
Monitoring
Compare actual quantities and draughts with the plan at agreed check points. Watch the midships draughts for growing deflection. Stop if the ship departs from the plan and re-run the loading instrument. Some large ships have hull stress monitoring: sensors that show real-time strain, useful in port and in heavy weather.
Fatigue
Fatigue is cracking caused by many cycles of stress, each well below the breaking stress. Repeated high still water BM, slamming and wave bending add up over the years. Keep BM well below 100 % when you can, and reduce speed or change heading in heavy head seas. Report and inspect cracks at hatch corners, bracket toes (where brackets meet plating) and the ends of longitudinals (lengthwise stiffeners).
Records and duties
Keep each loading condition, the instrument printouts and any deviations in the ship’s records. Under the ISM Code, company procedures should say who checks the plan and how. Hand over the plan and the stress status at each watch change during cargo work.
Key figures
- IACS UR S11
- Longitudinal strength standard behind permissible SF/BM
- IACS UR S1
- Content of the loading manual and loading instrument
- Harbour limits
- Only in sheltered conditions allowed by the loading manual
- Seagoing limits
- For departure, passage and arrival conditions
- Fatigue hot spots
- Hatch corners, bracket toes, ends of longitudinals
Building a safe loading sequence
- Start from the loading manual’s approved sequences and the terminal’s real rates. — Approved patterns and real rates define what is possible.
- Split each hold’s cargo into pours and match each step to the deballasting. — Cargo must not run ahead of ballast removal.
- Check every stage in the loading instrument; use harbour limits only for sheltered conditions permitted by the loading manual. — Intermediate peaks are common.
- Check the final condition against the seagoing limits and the stability criteria. — She must be fit for sea when she leaves.
- Set shipboard check points for draughts, cargo and ballast quantities, and stresses. — Detect a mismatch before approved limits are exceeded.
- At each check point compare draughts and quantities, re-run and adjust. — Shore figures and pump rates drift from the plan.
Remember
- Plan the whole sequence and check every stage, not only the end.
- Match the cargo rate to the ballast rate, or stop the loading.
- Changes in hull deflection call for a fresh check of the loading instrument and actual quantities.
- Fatigue builds from repeated cycles: keep stress margins and ease heavy-weather loads.
Common mistakes
Wrong: High loading rates are fine if the final condition is within limits.
Right: If cargo runs ahead of deballasting, intermediate stages can exceed limits. Match the rates or pause loading.
Wrong: Stresses below 100 % do no harm.
Right: Each cycle adds fatigue damage. Lower routine stress levels lengthen the hull’s life.
Worked case
A terminal loads at 6,000 t/h. Your plan needs 1 t of ballast out for every 3 t of cargo in, and your pumps discharge 1,500 t/h. What loading rate can you accept, and what do you do?
Show the answer
At 6,000 t/h the ballast must come out at 6,000 ÷ 3 = 2,000 t/h, but you can pump only 1,500 t/h. The fastest matching cargo rate is 1,500 × 3 = 4,500 t/h. Cap cargo intake at 4,500 t/h or use planned pauses; verify each stage against the approved limits.
Practice question
Which IACS Unified Requirement is the longitudinal strength standard?
- UR L5
- UR S11
- UR S1
- UR W11
Show the answer
Answer: B. UR S11 is the longitudinal strength standard. UR S1 covers loading manuals and instruments; UR L5 onboard stability software.
4 · Draught survey
The draught survey method
A draught survey finds the cargo weight from the ship’s displacement before and after loading. Every correction matters: one centimetre can be 50 tonnes.
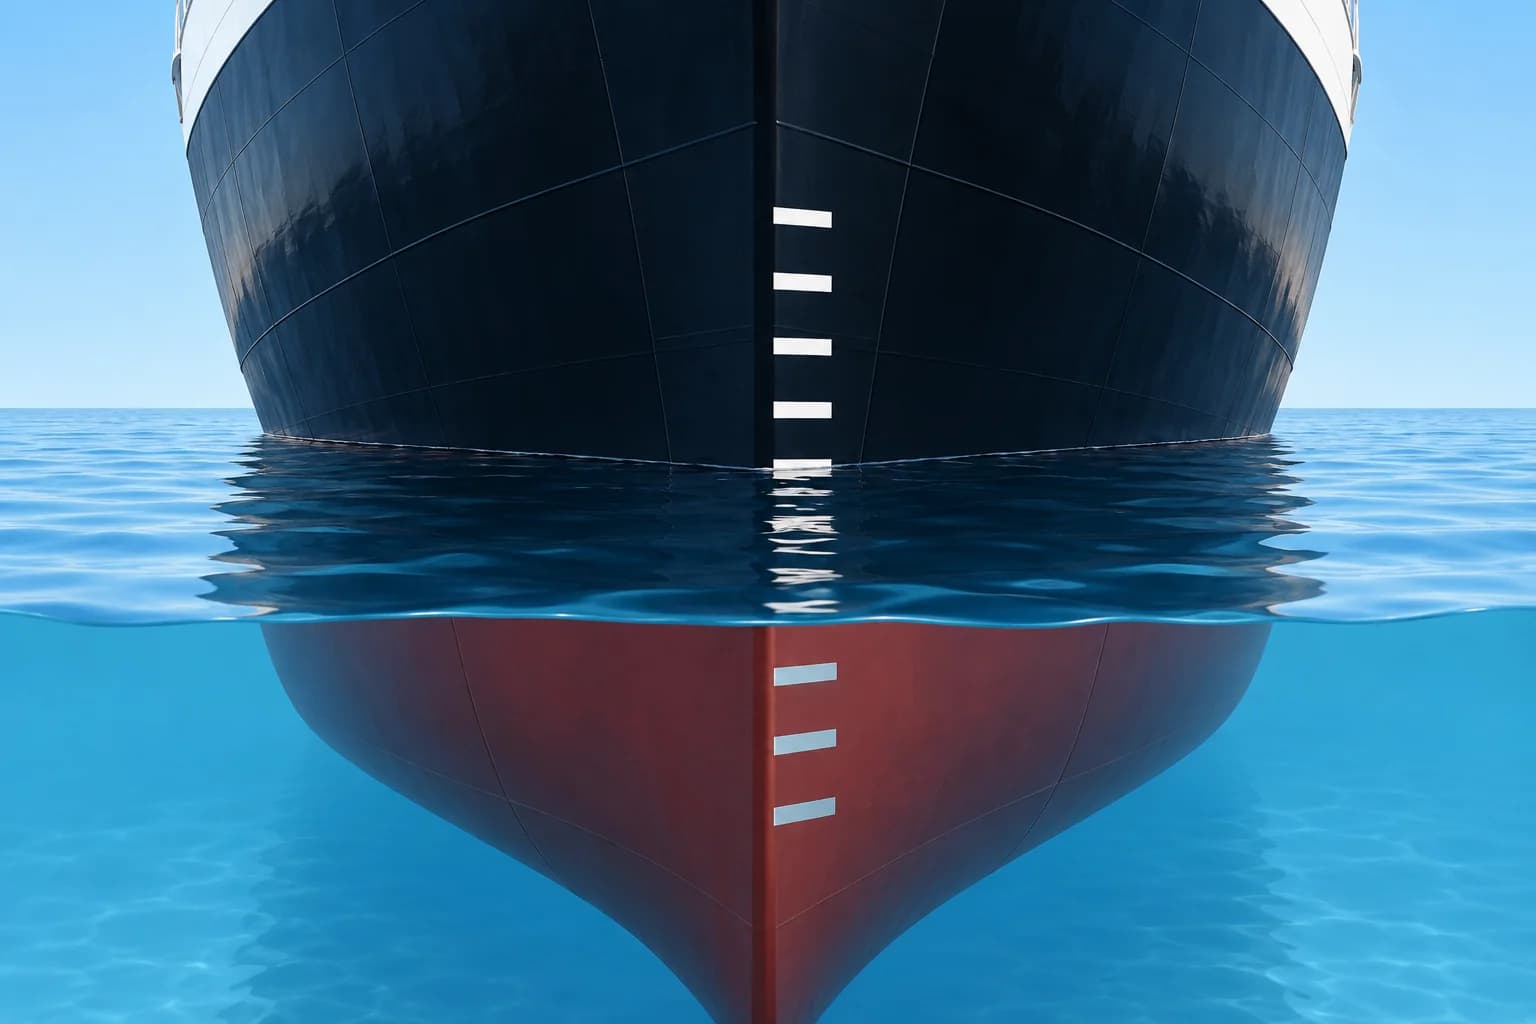
The idea
Read the draughts and find displacement in the hydrostatic tables. Deduct ballast, fresh water, bunkers and other measured variable weights. The remainder, called net displacement, is lightship plus the constant and any cargo. The constant covers unaccounted stores, spares and sediment. Cargo loaded is final minus initial net displacement, assuming lightship and constant are unchanged. The UN/ECE Code of 1992 for coal cargoes sets out the uniform procedure.
Six draughts and the perpendiculars
Read forward, midships and aft on both sides in calm conditions. Average corresponding readings. Correct forward and aft marks to their perpendiculars, and offset midships marks to geometric midships. Each trim correction has magnitude observed trim × longitudinal offset ÷ length between forward and aft marks. Determine its sign from whether the reference point is deeper or shallower than the mark.
Mean of means
Use the corrected forward (F), midships (M) and aft (A) draughts. The mean of means is (F + A + 2M) ÷ 4. The quarter mean, or mean of mean of means, is (F + A + 6M) ÷ 8. It allows for hog or sag, assuming the hull bends in a smooth curve. Enter the hydrostatic table with the quarter mean.
Trim corrections
Use true trim: corrected aft minus forward draught, in metres. Use its magnitude here. First correction (t) = trim × LCF (centre of flotation) from midships × TPC × 100 ÷ LBP. Add when LCF is towards the deeper end; subtract otherwise. Second correction (t) = 50 × trim² × ΔMCTC ÷ LBP. Here ΔMCTC = MCTC at QM + 0.5 m minus MCTC at QM − 0.5 m. It is normally added.
Density and deductibles
Tables are usually for salt water of 1.025 t/m³. Sample the dock water at several places and depths and use a draught survey hydrometer. Density correction = Δ × (ρ − 1.025) ÷ 1.025. Here Δ is displacement after both trim corrections; ρ is dock-water density in t/m³. Then sound every ballast and fresh water tank, take bunker figures from the engine room, and deduct them all.
Key figures
- Perpendicular correction
- Observed trim × mark offset ÷ length between marks
- Quarter mean
- (F + A + 6M) ÷ 8
- First trim correction (t)
- Trim × LCF × TPC × 100 ÷ LBP
- Second trim correction (t)
- 50 × trim² × ΔMCTC ÷ LBP
- ΔMCTC
- MCTC at QM + 0.5 m minus MCTC at QM − 0.5 m
- Density correction (t)
- Δ × (ρ − 1.025) ÷ 1.025
Remember
- Correct draughts to the forward perpendicular, amidships and after perpendicular before calculating the quarter mean.
- Use the quarter mean (F + A + 6M) ÷ 8 to allow for hog or sag.
- First trim correction: its sign follows the LCF and the trim; the second is normally added.
- Correct for water density; deduct ballast, fresh water, bunkers and other measured variable weights.
Common mistakes
Wrong: LCF in the table is always measured from midships.
Right: Some tables give LCF from the after perpendicular. Convert it to a distance from midships before using the formula.
Wrong: Reading the draughts in a swell from the quay is good enough.
Right: Read close to the water, from a boat if possible, and average several readings; use a tube or manometer in waves.
Wrong: Density only matters in fresh water.
Right: At the same measured draught, water of 1.018 t/m³ gives about 287 t less displacement than a 42,000 t table value for 1.025 t/m³. The ship’s mass does not change merely because water density changes.
Worked case
Final survey: trim 1.20 m by the stern, LCF 4.0 m aft of midships, TPC 45 t/cm, LBP 160 m, ΔMCTC 36 t·m/cm. Find both trim corrections. A colleague subtracts both corrections. Do you accept the result?
Show the answer
No. Check each sign rather than treating corrections as deductions. First: 1.20 × 4.0 × 45 × 100 ÷ 160 = +135 t. Trim by the stern and LCF aft point towards the same end, so add. Second: 50 × 1.20² × 36 ÷ 160 = +16.2 t, added. The total, +151.2 t, goes onto the table displacement.
Practice question
Forward at FP 6.00 m, aft at AP 7.00 m, midships 6.60 m. What is the quarter mean?
- 6.500 m
- 6.575 m
- 6.550 m
- 6.600 m
Show the answer
Answer: B. (6.00 + 7.00 + 6 × 6.60) ÷ 8 = 52.6 ÷ 8 = 6.575 m. 6.550 m is the mean of means; 6.500 m the mean of the ends.
5 · Survey example
A full draught survey, worked step by step
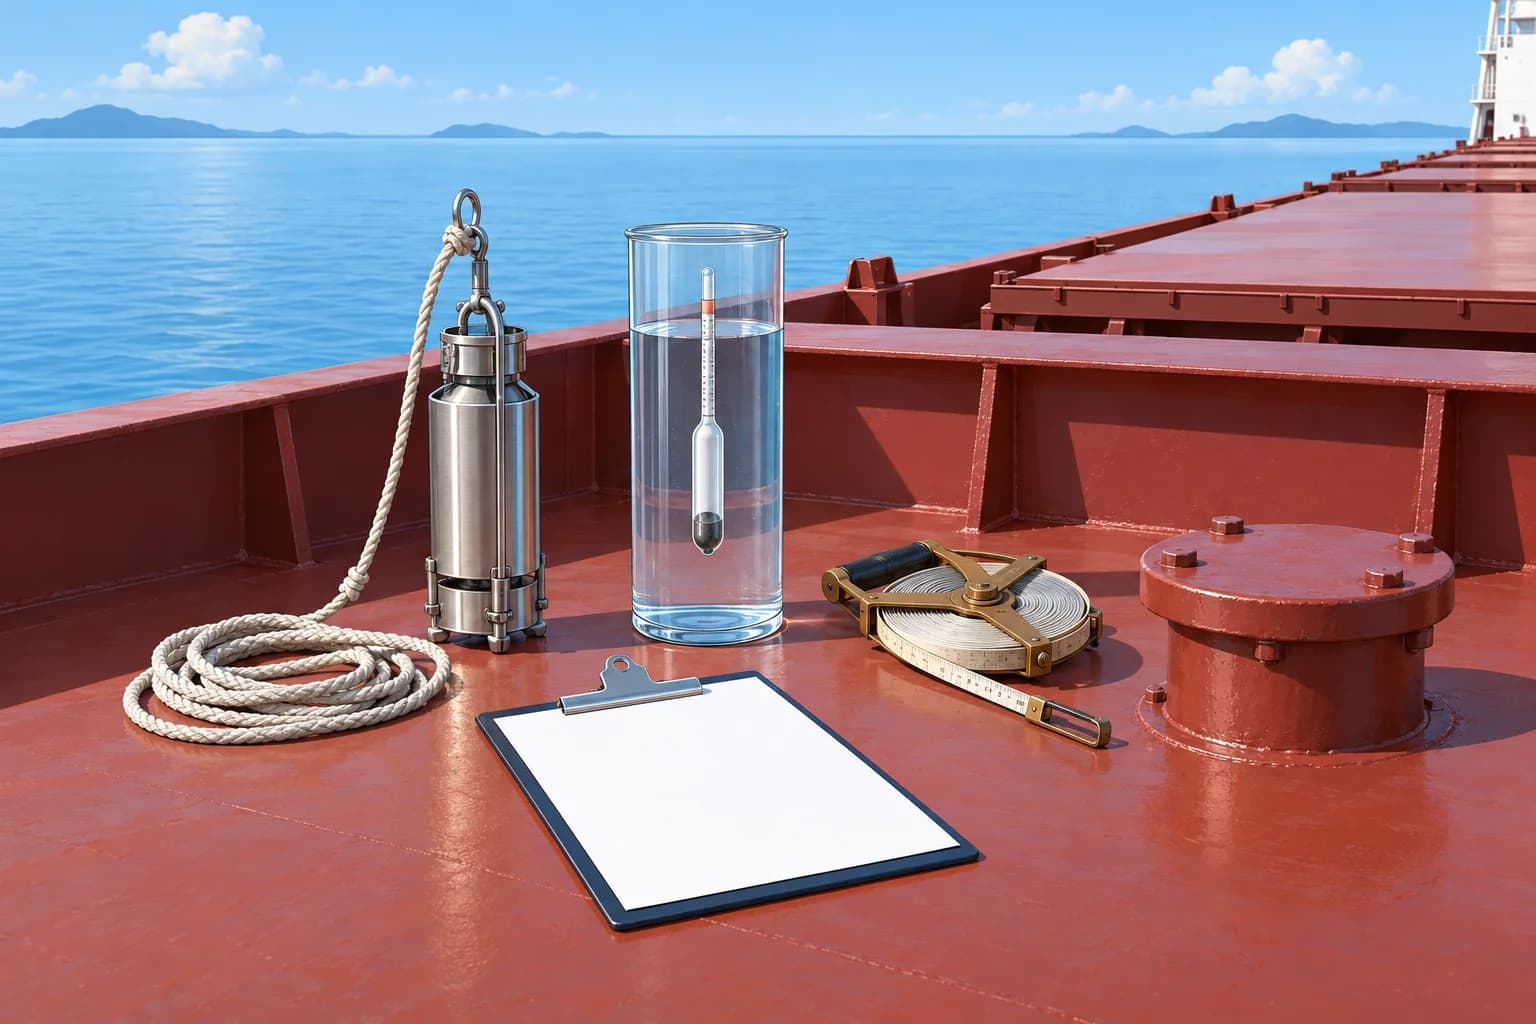
Follow one final draught survey from six draught readings to the weight of cargo loaded, using real hydrostatic values.
The ship and the readings
A bulk carrier of 180 m between perpendiculars finishes loading coal in dock water of 1.018 t/m³. Her forward marks are 2.40 m aft of the forward perpendicular, her aft marks 6.20 m forward of the after perpendicular, and her midships marks at midships. Readings, port and starboard: forward 9.10 and 9.14 m, midships 9.62 and 9.66 m, aft 10.16 and 10.20 m.
Hydrostatic data
From the table for 1.025 t/m³: at 9.60 m, Δ 41,850 t, TPC 50.45 t/cm, LCF 3.10 m aft of midships; at 9.70 m, Δ 42,355 t, TPC 50.55 t/cm, LCF 3.30 m aft. MCTC is 702 t·m/cm at QM + 0.5 m and 661 t·m/cm at QM − 0.5 m. Intermediate values are rounded for display; carry unrounded values throughout. Display final weights to one decimal place.
Deductibles
Soundings and engine room figures give ballast 420 t, fresh water 185 t and bunkers, including lubricating oil, 1,240 t: 1,845 t in all. The initial survey before loading found a net displacement of 10,230 t: lightship 9,850 t plus a constant of 380 t.
Result and checks
Cargo loaded = 40,060.1 − 10,230 = 29,830.1 t. Investigate and document any unexplained difference from the shore figure. Check the constant too. If it differs widely from previous voyages, look for an error before you sign.
Key figures
- Quarter mean
- ≈ 9.64544 m (hogging 2.2 cm)
- Table displacement
- 42,079.5 t at 1.025 t/m³
- Trim corrections
- +99.6 t (first) and +14.1 t (second)
- Density correction
- −288.1 t in dock water of 1.018 t/m³
- Net displacement
- 40,060.1 t after 1,845 t of deductibles
- Cargo loaded
- 40,060.1 − 10,230 = 29,830.1 t
Worked example: the final survey
- Means: F 9.12, M 9.64, A 10.18 m; observed trim 1.06 m by the stern. Length between marks = 180 − 2.40 − 6.20 = 171.40 m. — Averaging port and starboard removes list.
- Perpendicular corrections: F = 9.12 − 1.06 × 2.40 ÷ 171.40 ≈ 9.10516 m; A = 10.18 + 1.06 × 6.20 ÷ 171.40 ≈ 10.21834 m. True trim ≈ 1.11319 m. — With stern trim the FP is shallower and the AP deeper than the marks.
- Quarter mean = (F + A + 6 × 9.64) ÷ 8 ≈ 9.64544 m. Midships is 2.2 cm above the mean of the corrected ends: hogging. — The quarter mean corrects for the bent keel.
- Interpolation fraction = (QM − 9.60) ÷ 0.10 ≈ 0.45438. Δ = 41,850 + fraction × 505 = 42,079.5 t; TPC ≈ 50.49544 t/cm; LCF ≈ 3.19088 m aft. — Interpolate linearly; retain unrounded values throughout, including draughts and trim.
- Using unrounded trim, LCF and TPC: first = trim × LCF × TPC × 100 ÷ 180 = +99.6 t; second = 50 × trim² × 41 ÷ 180 = +14.1 t. Trimmed Δ = 42,193.2 t. — Stern trim and LCF aft point towards the same end, so add. Displayed rounded weights may not sum exactly.
- Density: trimmed Δ × (1.018 − 1.025) ÷ 1.025 = −288.1 t; corrected displacement = 41,905.1 t. Less deductibles of 1,845 t: net 40,060.1 t. — Net displacement = lightship + constant + cargo.
Remember
- Correct end marks to the perpendiculars and offset midships marks to midships before calculating the quarter mean.
- Interpolate the hydrostatic table at the quarter mean.
- Here both trim corrections are added and the density correction subtracted.
- Cargo = final net displacement − initial net displacement.
Common mistakes
Wrong: Enter the table with the mean of forward and aft, 9.662 m.
Right: That ignores the 2.2 cm hog and overstates the cargo by about 80 t. Use the quarter mean.
Wrong: Leave out the dock water density.
Right: The table assumes 1.025 t/m³. Without the correction you would overstate the cargo by 288 t.
Wrong: Subtract the first trim correction out of habit.
Right: Check the direction: with stern trim and LCF aft it is added. Getting the sign wrong costs about 199 t here.
Worked case
At the initial survey the constant came out at 380 t, but the last three voyages gave 150–190 t. Shore scales show 29,600 t loaded; your survey gives 29,830.1 t. What do you do?
Show the answer
Investigate the changed constant and reconcile the roughly 230 t difference before accepting the cargo figure. Recheck both surveys’ draughts, densities and deductibles; ask for shore weighing records. Do not adjust the constant to match shore scales. Different methods alone do not explain the discrepancy. If unresolved, report it under company procedures and record both figures and the outstanding discrepancy before signing.
Practice question
Observed trim 1.06 m by the stern; aft marks 6.20 m forward of the after perpendicular; length between marks 171.40 m. What is the correction to the aft draught?
- Subtract 0.038 m
- Add 0.038 m
- Add 0.383 m
- Subtract 0.015 m
Show the answer
Answer: B. 1.06 × 6.20 ÷ 171.40 = 0.038 m. With stern trim the AP, aft of the marks, is deeper, so add.