Navigation · Level R2 · 5 parts · about 15 min
Reading a nautical chart: latitude, longitude, symbols and depths
5 short parts: Lat and long · Projection, scale · Depths and heights · Chart symbols · Datum and ENCs. Each part explains the idea, then gives the points to remember, the common mistakes, a worked case and a practice question; the Academy unit adds all 29 check questions.
1 · Lat and long
Latitude and longitude: giving a position
Every point on Earth has a latitude north or south of the equator and a longitude east or west of Greenwich. Together they give a position.
Latitude
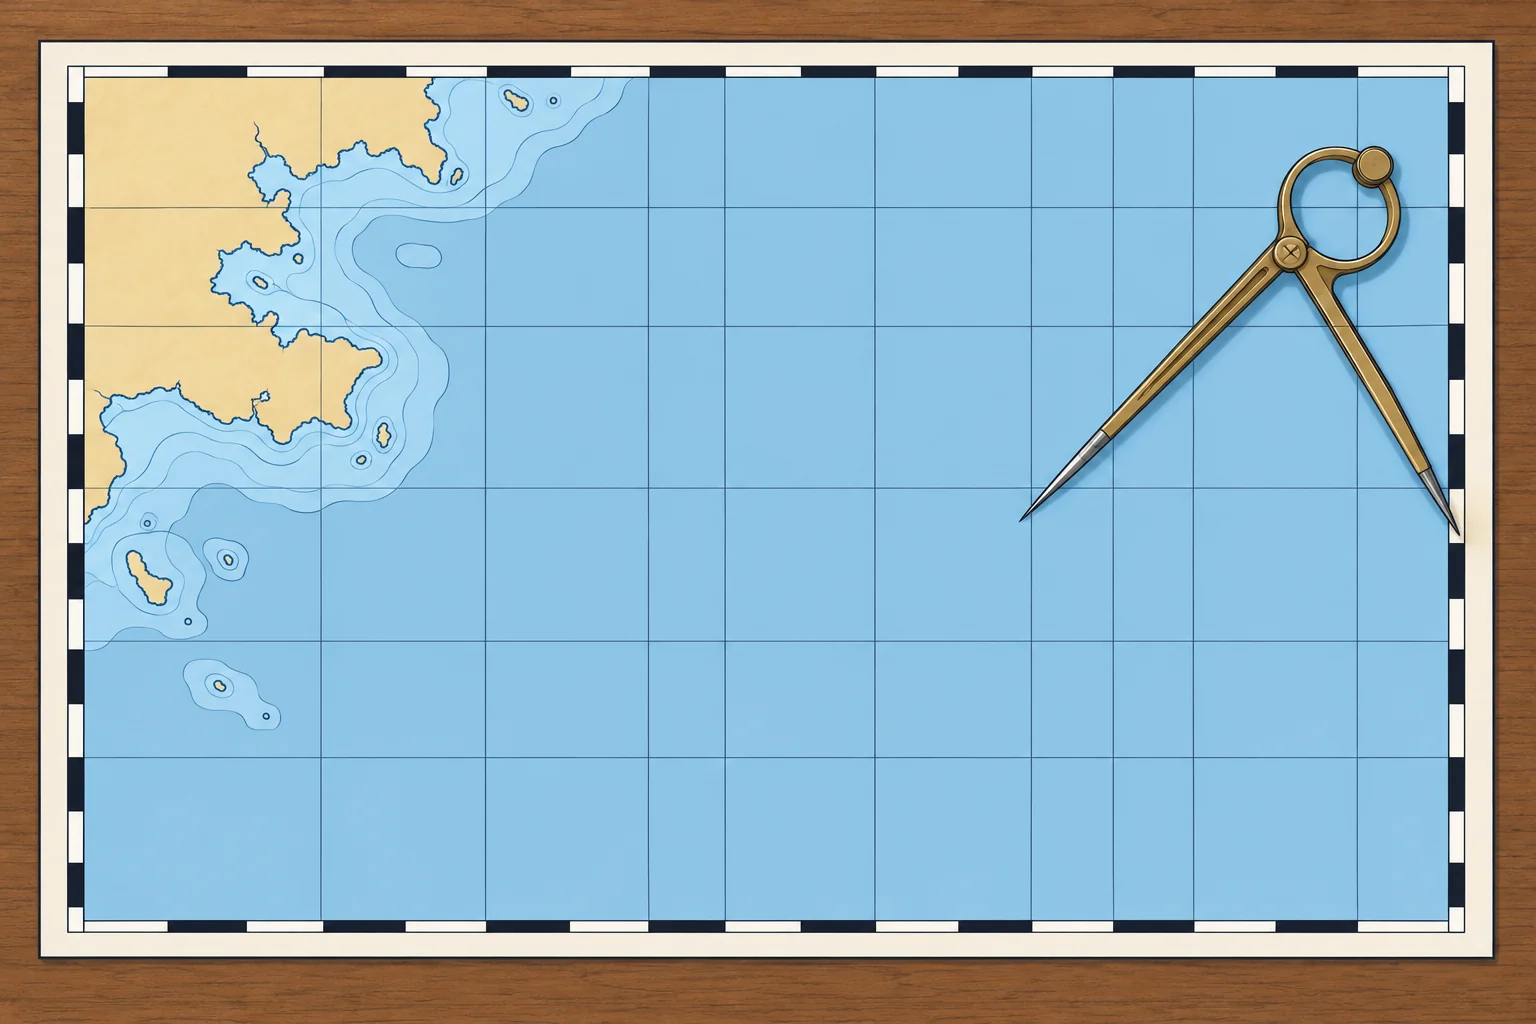
Latitude tells you how far north or south of the equator a place is, from 0° at the equator to 90° at each pole. Lines of equal latitude, called parallels, run east–west around the globe. Always add N or S. On a chart you read latitude on the latitude scale printed down the left and right edges.
Longitude
Longitude tells you how far east or west a place is from the prime meridian through Greenwich, from 0° to 180° E or W. The north–south lines joining the poles are meridians. Always add E or W. You read longitude on the scale along the top and bottom edges of the chart.
Degrees and minutes
Each degree has 60 minutes (′). Charts and plotters usually give minutes with decimals: 41°23.4′N 002°10.8′E. Each minute has 60 seconds (″): 41°23.4′N equals 41°23′24″N. Check which format your device uses before you copy a position. Give latitude first, then longitude, with three digits for the degrees of longitude.
The nautical mile
One nautical mile (M) is exactly 1852 m, approximately one minute of latitude. A cable is a tenth of a nautical mile, about 185 m. One nautical mile per hour is one knot (kn). A minute of longitude is only about a nautical mile long at the equator: meridians close up towards the poles, so longitude minutes get shorter towards either pole.
Plotting and reading
A position lies where its latitude parallel and longitude meridian cross; read latitude from the side scale and longitude from the top or bottom scale—the Chartwork unit covers the tools and method.
Key figures
- Nautical mile
- 1 nautical mile = 1852 m, approximately 1′ of latitude
- Cable
- 0.1 M, about 185 m
- Knot
- 1 nautical mile per hour
- Writing a position
- Latitude first: 41°23.4′N 002°10.8′E
- Ranges
- Latitude 0–90° N/S; longitude 0–180° E/W
Remember
- Latitude: 0–90° N or S of the equator, read on the side scale.
- Longitude: 0–180° E or W of Greenwich, read on the top and bottom scale.
- Write latitude first: 41°23.4′N 002°10.8′E. Check minutes-and-decimals against seconds.
- 1 nautical mile = 1852 m, approximately 1′ of latitude; a cable is 0.1 M.
Common mistakes
Wrong: A minute of longitude is a nautical mile, just like a minute of latitude.
Right: Use latitude minutes for nautical miles in ordinary chartwork. Longitude minutes shrink towards the poles.
Wrong: 41°23.4′ and 41°23′40″ are the same position.
Right: 0.4′ is 24″, not 40″. Check whether your device shows decimal minutes or seconds.
Wrong: You can leave out N, S, E or W when everyone knows the area.
Right: Always give them. At the equator, 5°E and 5°W are about 600 nautical miles apart.
Worked case
A friend radios: they are at 39°34.5′N 002°38.0′E. You record them at 39°38.0′N 002°34.5′E. Before altering course to meet them, what must you check?
Show the answer
Do not use the recorded position yet. Read the received position back digit by digit and confirm it with your friend. You swapped the latitude and longitude minutes. Replot the confirmed position before altering course.
Practice question
Which latitude equals 41°23.4′N?
- 41°23′24″N
- 41°23′40″N
- 41°24′00″N
- 41°04′23″N
Show the answer
Answer: A. Each minute has 60 seconds, so 0.4 × 60 = 24 seconds: 41°23.4′N equals 41°23′24″N.
2 · Projection, scale
Mercator charts, scale and measuring distance
A straight line on a Mercator chart keeps a constant direction relative to true north. Use the latitude scale for distance and the largest-scale chart to navigate.
Why a projection
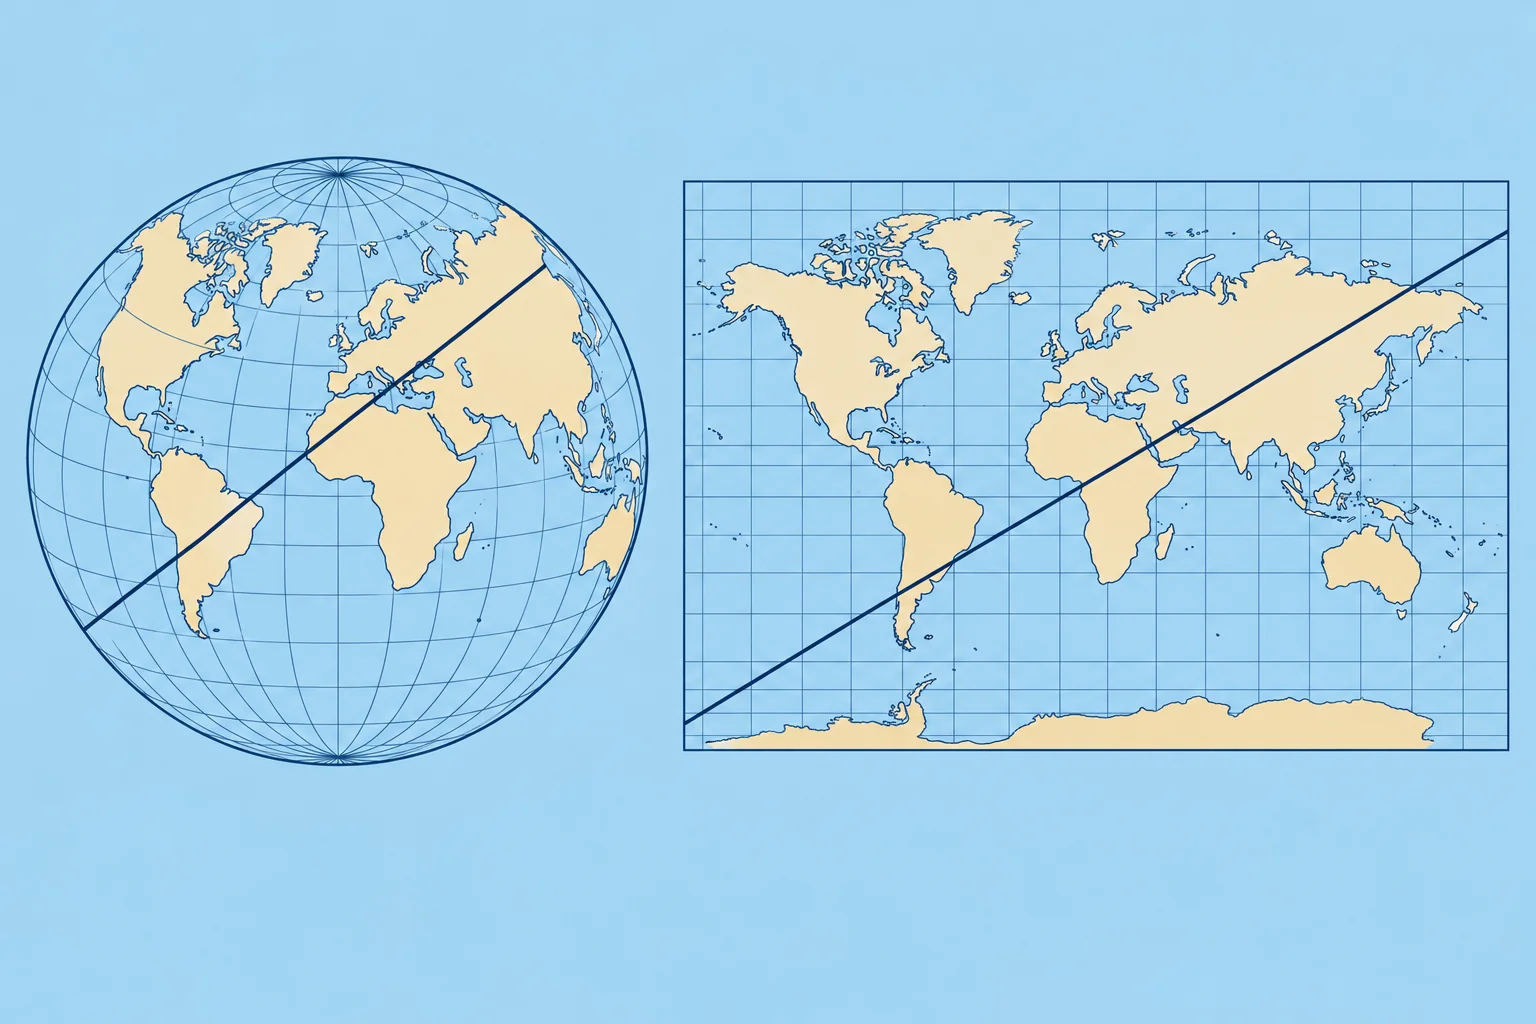
The Earth is round; a chart is flat. A projection is the method used to draw one on the other, and every projection distorts something. Most sea charts use the Mercator projection: meridians are drawn as straight parallel lines, and parallels as straight lines at right angles to them.
What Mercator keeps
Meridians never meet on the chart, so it stretches east–west away from the equator. To keep local shapes and angles right, it stretches north–south too: latitude minutes grow towards either pole. A straight line is a rhumb line, crossing every meridian at the same angle. Its direction relative to true north (towards the North Pole) stays constant; the heading you steer may need adjustment for wind and current.
Measuring distance
Open your dividers (a two-pointed measuring tool) across the distance, then lay them on the latitude scale beside it, at about the same latitude, and count the minutes: each minute is one mile. Never use the longitude scale at the top or bottom. On a chart that covers many degrees of latitude, measure a long leg in shorter steps, each against its own latitude.
Chart scale
The scale compares distance on the chart with distance on the Earth. At 1:50 000, 1 cm on the chart is 500 m. A large-scale chart, such as a 1:10 000 harbour plan, shows a small area in great detail. A small-scale chart, such as 1:1 000 000, covers a large area with little detail. Remember: large scale, large detail, small area.
Choosing the chart
Get the overview on a small-scale chart, then navigate on the largest-scale chart available for the water you are in: it shows more rocks, buoys and soundings. Some harbour plans carry their own distance scale bar; use it on that plan.
Key figures
- 1:50 000
- 1 cm on the chart = 500 m
- Distance
- Latitude scale, level with the leg: 1′ = 1 M
- Rhumb line
- Straight on Mercator; constant direction relative to true north
- Large scale
- e.g. 1:10 000: small area, most detail
Remember
- Mercator: meridians parallel; a straight rhumb line has a constant direction relative to true north.
- Measure distance on the latitude scale, level with what you measure. Never the longitude scale.
- Large scale (1:10 000) = small area, most detail. Small scale (1:1 000 000) = big area, little detail.
- Navigate on the largest-scale chart available.
Common mistakes
Wrong: Use whichever edge scale is nearest for distance.
Right: Use only the latitude scale at the sides. The longitude scale is shorter away from the equator and gives distances that are too big.
Wrong: 1:1 000 000 is a large-scale chart because the number is large.
Right: It is small scale: things look small. Large scale means a small number after the colon, such as 1:10 000.
Wrong: Any part of the latitude scale gives the same mile.
Right: On Mercator the scale grows towards the poles. Measure level with the distance you want.
Worked case
You need the distance between two headlands on a 1:200 000 chart at about 44°N. A crew member lays the dividers on the top scale and reads 15 miles. What do you tell them?
Show the answer
Use the latitude scale at the side, level with the leg at about 44°N. A minute of longitude here is only about 0.72 M, so 15 minutes on the top scale is roughly 11 M, not 15. Re-measure on the latitude scale, where each minute is one mile.
Practice question
Which scale do you use to measure distance on a Mercator chart?
- The longitude scale at the top
- The scale on the compass rose
- The latitude scale at the side
- Either one; they are the same
Show the answer
Answer: C. Only the latitude scale gives nautical miles: 1′ of latitude = 1 M.
3 · Depths and heights
Chart datum, depths, drying heights and heights
Depths are measured down from chart datum, drying heights up from it. Land, light and clearance heights use high-water levels. The title notes say which.
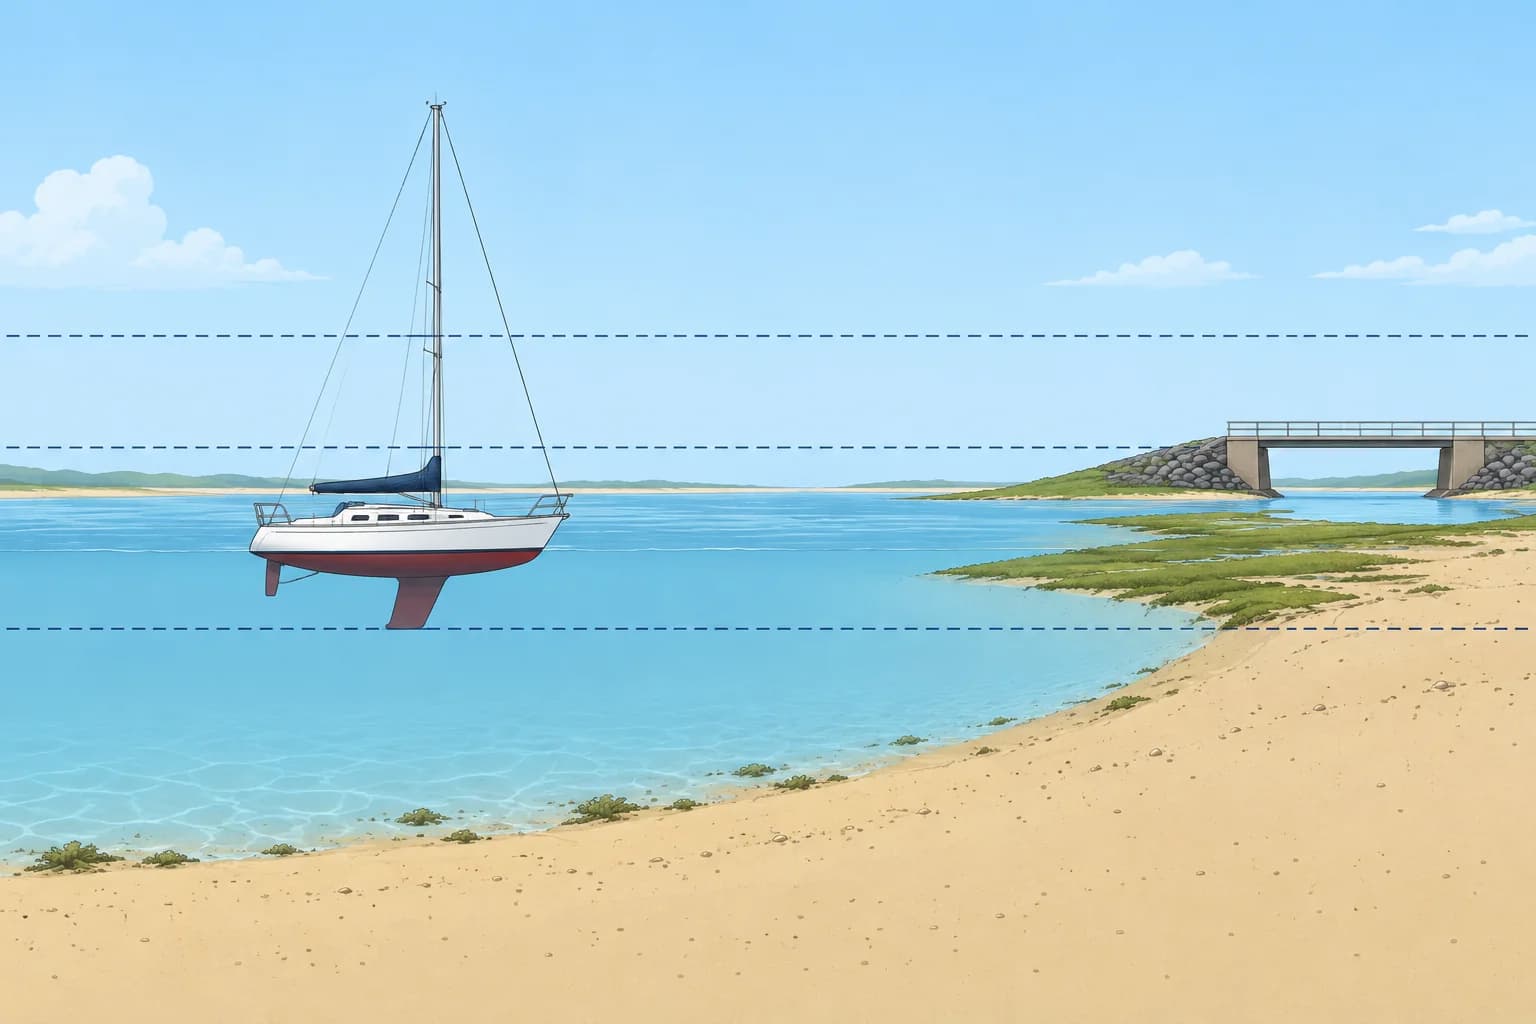
Chart datum
Chart datum (CD) is the level from which charted depths are measured. In tidal waters it is usually LAT, the lowest astronomical tide: about the lowest level the tide reaches in normal weather. So there is nearly always more water than charted, but high air pressure or offshore winds can push the sea lower. The title notes of each chart say which datum it uses.
Depths
A sounding is a charted depth below chart datum. Check the chart's stated units: metres, fathoms or feet. On a metric chart, a large 4 followed by a smaller 2 means 4.2 m. Depth contours join equal depths. Actual depth = charted depth + height of tide. The Tides and heights unit shows how to find the height of tide.
Drying heights
Areas that cover and uncover with the tide are usually coloured green. Their figures are drying heights, shown underlined: an underlined 2 with a small 1 means the seabed there stands 2.1 m above chart datum. With a height of tide of 3.0 m, that spot has only 0.9 m of water over it.
Heights and clearances
Land heights and light elevations (heights) use a stated high-water level, often MHWS (mean high water springs, average high water at spring tides). Modern Admiralty charts normally reference vertical clearances (room overhead) to HAT (highest astronomical tide, highest predicted astronomical tide level); other charts may use another level. Check every chart's notes. Weather can raise water above HAT and reduce clearance. For overhead power cables, use the stated safe clearance, allowing for electrical discharge, rather than physical height alone.
Keep a margin
Charted depths come from surveys that may be old or patchy, and sand moves. Keep a safety margin under the keel, larger over rock, in waves or where the survey is old.
Key figures
- Chart datum (tidal waters)
- Usually LAT, lowest astronomical tide
- Actual depth
- Charted depth + height of tide
- Water over a drying height
- Height of tide − drying height
- Light elevations
- Above a high-water level, usually MHWS
- Bridge and cable clearances
- Normally HAT on modern Admiralty charts; check every chart’s notes
Remember
- Depths are below chart datum, usually LAT in tidal waters.
- Actual depth = charted depth + height of tide.
- Underlined figures are drying heights above chart datum: water over = height of tide − drying height.
- Heights often use MHWS; modern Admiralty clearances normally use HAT. Check every chart’s notes.
- Read the chart's title notes for its datums and units.
Common mistakes
Wrong: Chart datum is the average sea level.
Right: In tidal waters it is usually LAT, close to the lowest tide, so charted depths are a cautious minimum.
Wrong: There can never be less water than charted.
Right: High pressure, offshore winds, old surveys and moving sand can all leave less water than the chart shows.
Wrong: A bridge clearance is measured from chart datum.
Right: Use the chart's stated high-water reference: normally HAT on modern Admiralty charts. Check every chart's notes. Weather can reduce clearance; use the stated safe clearance for power cables.
Worked case
You plan to anchor for lunch where the chart shows 1.5 m. Your keel draws 1.8 m. The height of tide is 2.4 m at noon and falls to 0.6 m by 18:00. Is it a good spot for the afternoon?
Show the answer
At noon the depth is 1.5 + 2.4 = 3.9 m, leaving 2.1 m under the keel. By 18:00 it is 1.5 + 0.6 = 2.1 m, only 0.3 m under the keel, and less in any swell. That margin is too small: anchor in deeper water or leave well before the tide falls.
Practice question
In tidal waters, what level is chart datum usually set to?
- Average (mean) sea level
- Mean high water springs
- Highest astronomical tide
- Lowest astronomical tide
Show the answer
Answer: D. Most charts in tidal waters use LAT, so the water is rarely lower than charted.
4 · Chart symbols
Chart symbols and the INT 1 key
Chart symbols follow one international key, INT 1. Learn the colours, the dangers and the seabed letters, and keep your charts corrected.
One key for the world
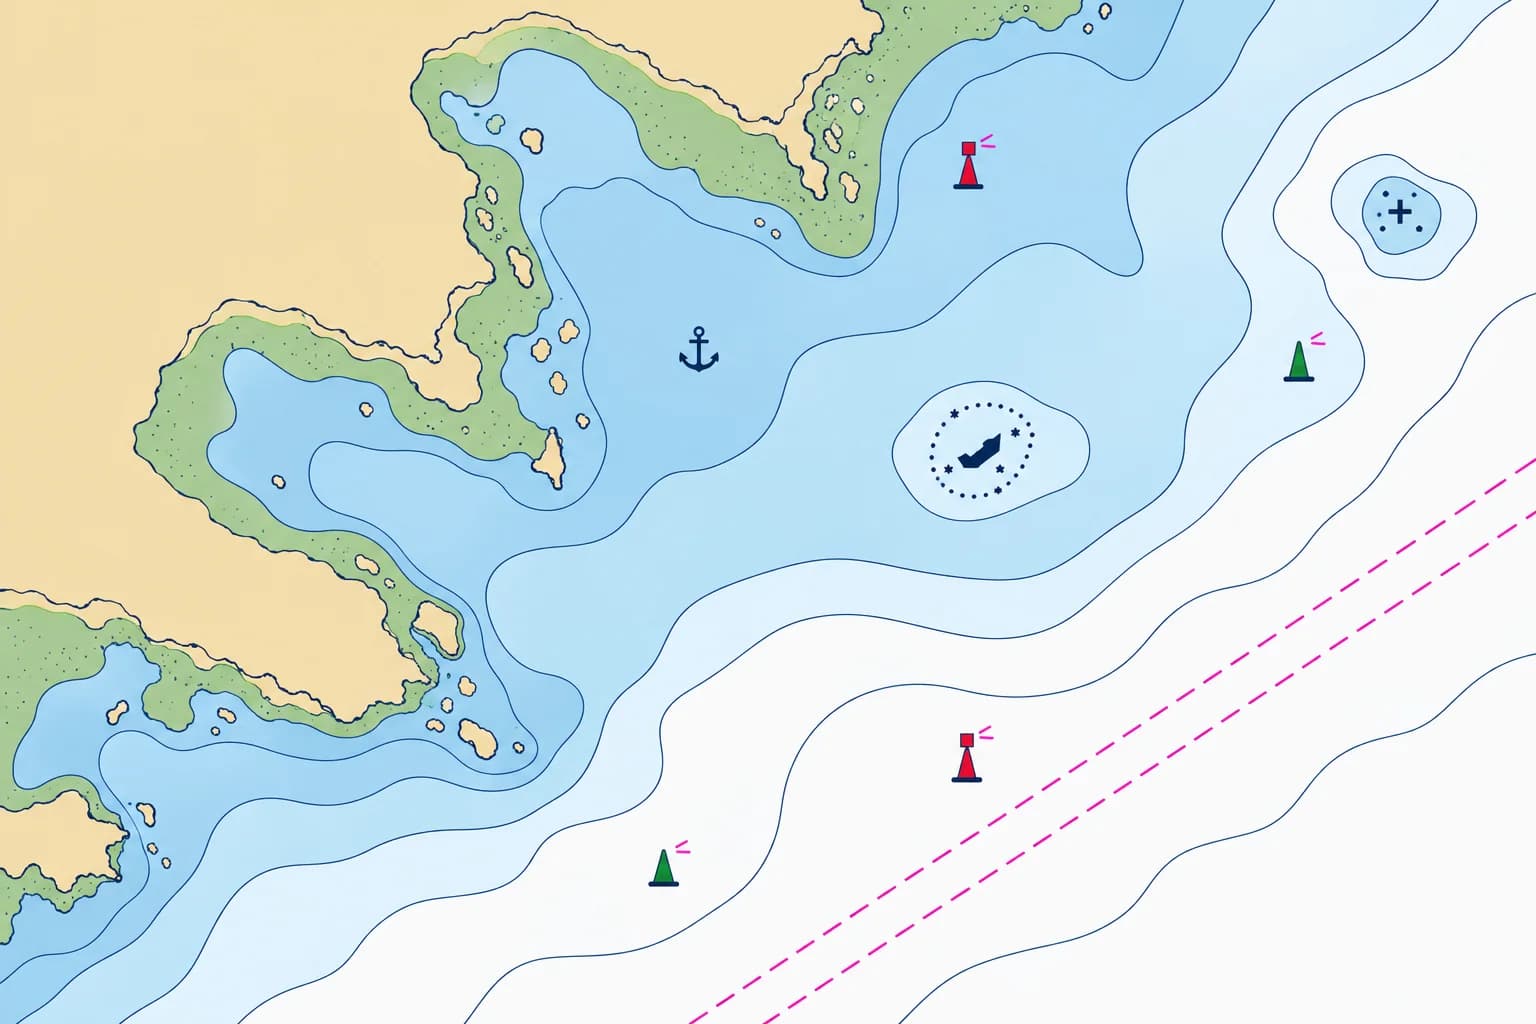
Chart symbols follow a standard set by the IHO (International Hydrographic Organization). The key is INT 1, published by each national office: NP5011 for Admiralty charts, US Chart No. 1 for US charts. Most symbols are the same worldwide, so learning INT 1 once lets you read almost any official chart. Keep a copy aboard.
Colours
On paper charts land is usually buff or yellow, areas that dry are green, shallow water is blue and deeper water is white. Magenta marks lights, many notes, and restricted areas, cables and pipelines. How deep the blue goes varies between charts, so read the soundings and contours, not the colour alone.
Dangers
A rock awash at chart datum is a cross with a dot in each corner. A rock that covers and uncovers is drawn as a small star with its drying height. An underwater rock dangerous to surface navigation is a cross. Wreck symbols vary with exposure and known depth: a submerged wreck may be labelled Wk, with a depth or danger line; check INT 1. A danger line is a dotted boundary marking danger to surface navigation.
Seabed and areas
Letters describe the seabed: S sand, M mud, G gravel, R rock, Sh shells, Wd weed. That helps you choose where to anchor. An anchor symbol marks an anchorage. Magenta lines with notes show restricted areas, and submarine cables and pipelines, where anchoring is often prohibited.
Chart corrections
Check that you have the current paper-chart edition, then apply outstanding Notices to Mariners after its last recorded correction. Also check Temporary and Preliminary (T&P) Notices still in force. These notices report new wrecks, moved buoys and changed lights. The IALA module covers buoy and light identification.
Key figures
- Symbol key
- INT 1: NP5011 (Admiralty), US Chart No. 1
- Seabed
- S sand, M mud, G gravel, R rock, Sh shells, Wd weed
- Magenta
- Lights, notes, restricted areas, cables, pipelines
- Corrections
- Current edition; outstanding Notices after last correction
Remember
- Symbols follow the IHO key INT 1 (NP5011, US Chart No. 1).
- Buff land, green drying areas, blue shallows, white deep water, magenta lights and notes.
- A dotted danger line round a rock or wreck means it matters to surface vessels.
- Seabed letters (S, M, G, R, Sh, Wd) help you choose an anchorage.
- Use the current edition; apply outstanding Notices to Mariners after its last correction; check T&P Notices in force.
Common mistakes
Wrong: White water on the chart is always safe.
Right: White only means deeper than the chart's shading limit. Read the soundings and look for danger symbols.
Wrong: A new-looking chart needs no corrections.
Right: Check that it is the current edition, then apply outstanding Notices to Mariners after its last recorded correction.
Wrong: Anchor anywhere the depth suits you.
Right: Check the seabed letters and the magenta notes: cable, pipeline and restricted areas often forbid anchoring.
Worked case
For a lunch stop you compare two bays. Bay A: 4 m, S, an anchor symbol. Bay B: 5 m, R, inside a magenta cable area. Which do you choose and why?
Show the answer
Bay A. Sand gives good holding and the anchor symbol marks an anchorage. In Bay B, rock gives poor holding and can trap the anchor, and anchoring in a cable area is usually prohibited and can damage the cable. Still check the depth against the tide and the shelter from the wind.
Practice question
What is INT 1?
- A COLREG rule on navigation lights
- The international chart symbol key
- The chart datum used across Europe
- The first chart in every chart folio
Show the answer
Answer: B. INT 1 is the IHO key to chart symbols, abbreviations and colours.
5 · Datum and ENCs
Horizontal datum, WGS84 and electronic charts
Satellite positions use WGS84. Check that your chart uses it too, or apply its shift note. Electronic charts come as raster images or vector data.
Horizontal datum
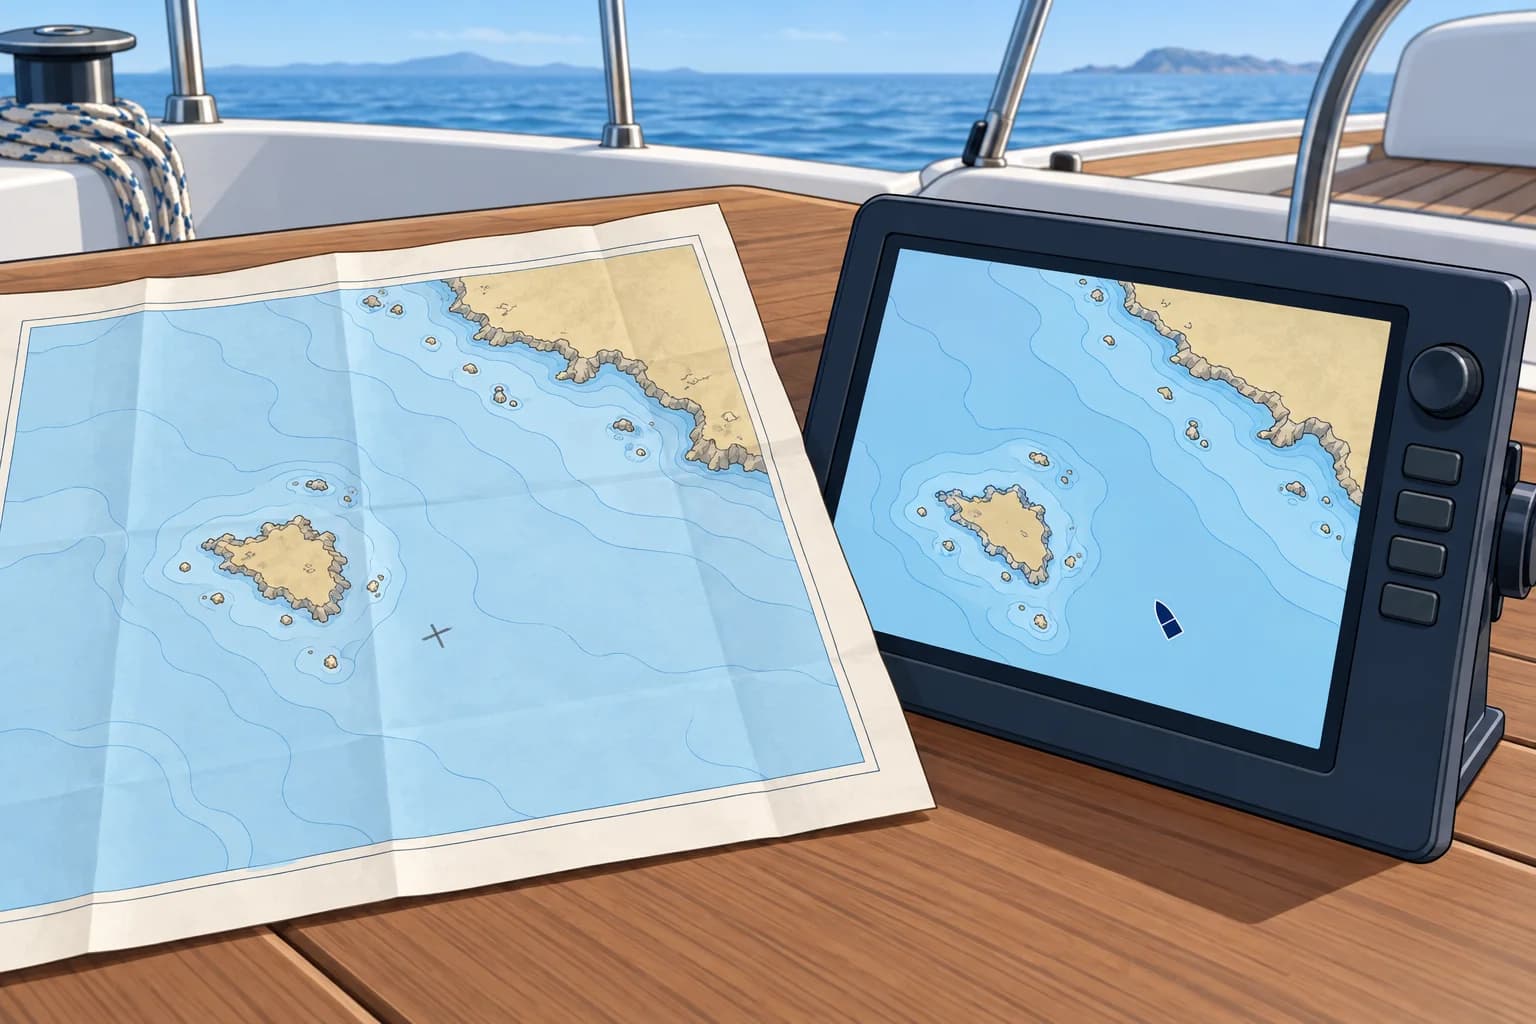
A horizontal datum is the reference system for latitude and longitude. GNSS means global navigation satellite system; GPS is one example. Marine receivers normally display positions on WGS84 (World Geodetic System 1984). Most modern charts use WGS84 or a compatible datum, such as ETRS89 (European Terrestrial Reference System 1989). Read the chart's title notes to check its datum.
Older charts
Some charts, especially of remote areas or from old surveys, use a local datum such as ED50 or OSGB36. A note, often headed "Satellite-derived positions", gives a shift to apply, for example 0.04′ southward and 0.09′ eastward. Errors of 100 m or more are common if you ignore it, and in a few remote places charted features are more than a mile out.
Raster and vector
A raster chart is a scanned image of a paper chart: it looks familiar but cannot tell you what each feature is. A vector chart stores every feature as data, so the display redraws as you zoom and can warn you of shallow water. The official vector chart is the ENC (Electronic Navigational Chart), made by hydrographic offices to the IHO S-57 standard; its successor, S-101, is being introduced from 2026.
On a yacht
Most recreational plotters use private vector charts built from official data, not ENCs. Keep charts updated and use WGS84 for modern electronic charts; follow the equipment instructions before changing datum settings. Apply a paper chart's stated shift when plotting positions onto it, and carry a current paper chart of your area. The Electronic navigation unit covers ENCs, plotters and their errors in depth.
Key figures
- GNSS datum
- WGS84 (ETRS89 is the European equivalent)
- Ignoring an old-datum shift
- Often 100 m or more; read the datum note
- Official vector chart
- ENC: IHO S-57; S-101 from 2026
- Raster chart
- Scanned image of a paper chart
Remember
- GNSS positions are on WGS84; most modern charts are too.
- On an older chart, apply the satellite-derived positions shift, or expect errors of 100 m or more.
- Raster = scanned picture; vector = data that redraws and can warn.
- ENC is the official vector chart (IHO S-57; S-101 arriving from 2026).
Common mistakes
Wrong: A GPS position fits every chart exactly.
Right: Matching datums removes the datum shift, not survey errors. Read the title notes and apply any shift.
Wrong: A plotter chart is an official ENC.
Right: Most recreational charts are private products. They can be good, but they are not official ENCs.
Wrong: No shift note means no datum problem.
Right: Some old charts have never been checked against WGS84. Treat a GNSS position on them with care.
Worked case
A paper chart says: “To plot WGS84 positions, move them 0.04′ south and 0.09′ east.” Your GPS shows 50°12.50′N 001°20.00′W. What position do you plot?
Show the answer
Plot 50°12.46′N 001°19.91′W. Moving south reduces north latitude; moving east reduces west longitude. Apply this shift once when plotting the position on this paper chart.
Practice question
Which horizontal datum do GNSS receivers such as GPS use?
- WGS84
- ED50
- OSGB36
- LAT
Show the answer
Answer: A. GNSS positions are on WGS84. LAT is a vertical datum for depths.