
Navigation · Level R4 · 4 parts · about 14 min
Tides in depth: secondary ports, tidal curves and clearances
4 short parts: Secondary ports · Tidal curves · Twelfths' limits · Clearances. Each part explains the idea, then gives the points to remember, the common mistakes, a worked case and a practice question; the Academy unit adds all 25 check questions.
1 · Secondary ports
Secondary ports: time and height differences
A secondary port has no daily predictions of its own. You take a standard port's HW and LW and apply interpolated time and height differences.
Standard and secondary
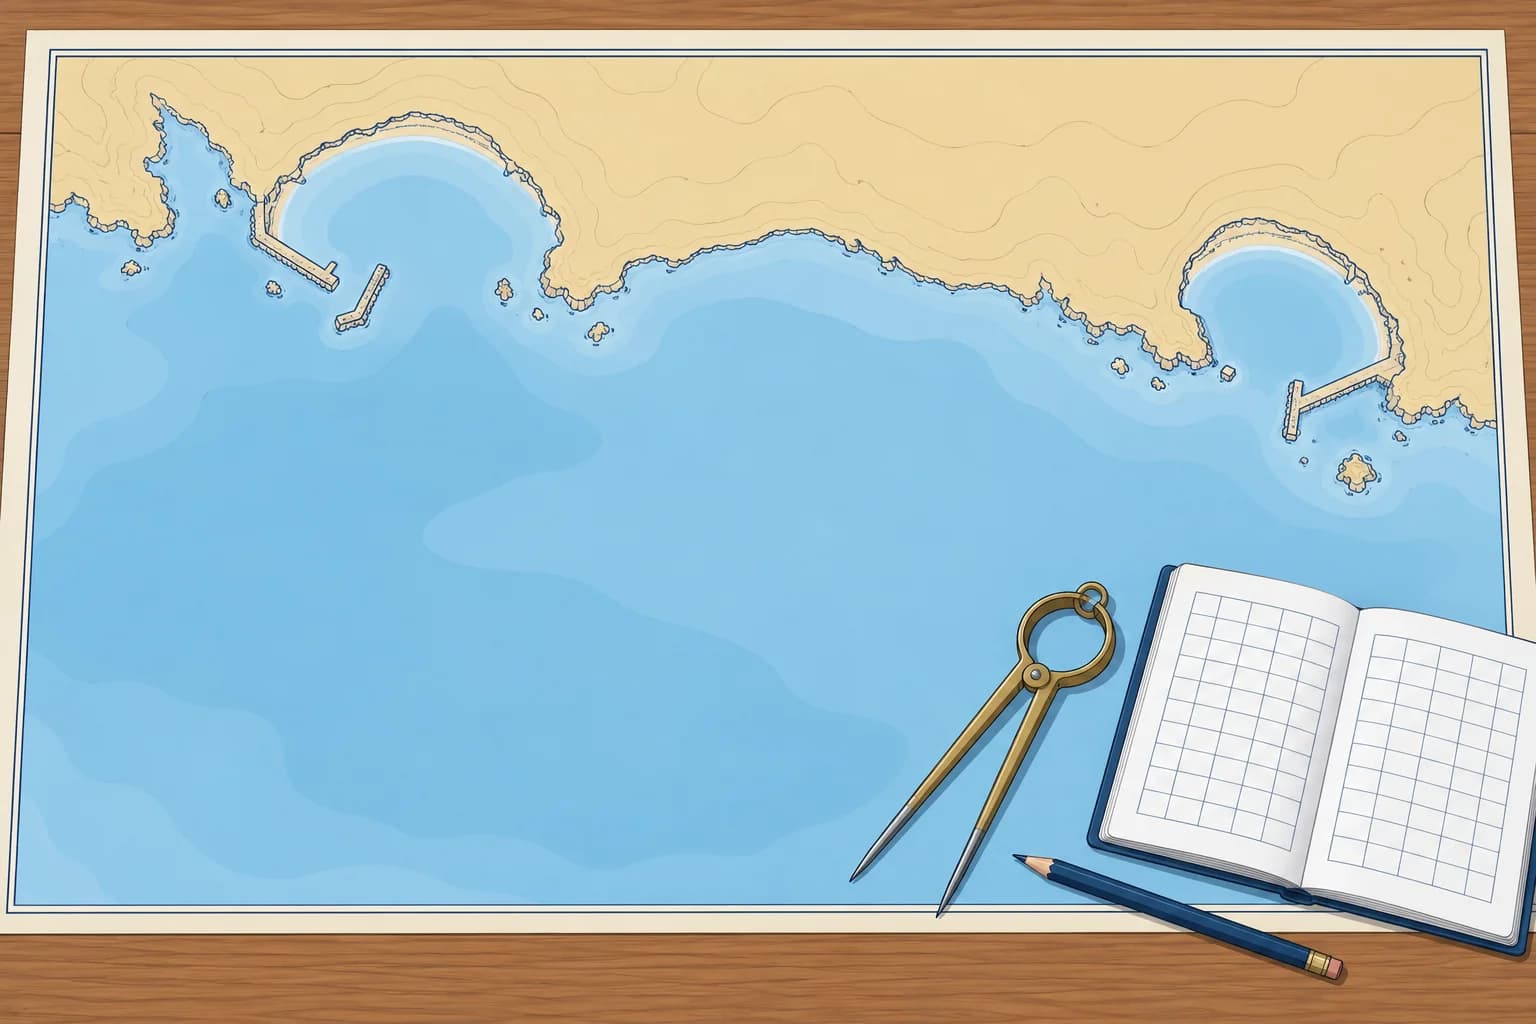
A standard port has full daily predictions of high water (HW) and low water (LW). A secondary port has only a table of differences from a named standard port. That port is chosen because its tide has a similar shape, so it is not always the nearest. The table has four parts: HW times, LW times, HW heights and LW heights. In both worked examples, seasonal corrections are zero and all times use the tables’ printed zone.
Time differences
The table gives a difference for two standard-port HW times, such as 0000 and 0600, each repeating 12 hours later, and the same for LW. When today's standard HW falls between them, interpolate: work out how far it lies between the two times as a fraction, and take the same fraction between the two differences. A difference of −0110 means 1 h 10 min earlier, not 110 minutes.
Height differences
Heights work the same way. HW differences are given at MHWS and MHWN (mean high water springs and neaps), LW differences at MLWN (mean low water neaps) and MLWS (mean low water springs). Find where today's standard-port height lies between the two mean levels and take the same fraction between their differences. On a tide bigger than mean springs, extend the same straight line with care. Round the answers to 0.1 m and the nearest minute.
Worked HW example
Standard HW is 0900, 4.6 m. HW time differences are −0040 at 0600 and −0020 at 1200, repeating 12 h later. 0900 lies halfway, so the difference is −0030: 0830. Height differences are −0.4 m at MHWS 5.0 m and −0.2 m at MHWN 4.0 m. The height fraction is (4.6 − 4.0) ÷ (5.0 − 4.0) = 0.6. The correction is −0.32 m: HW height = 4.28 m, rounded to 4.3 m.
Worked LW example
Standard LW is 1530, 1.0 m. LW time differences are −0015 at 0100 and −0035 at 0700, repeating 12 h later. 1530 is 2.5/6 from 1300 to 1900, so the difference rounds to −0023: 1507. Height differences are −0.1 m at MLWN 1.8 m and 0.0 m at MLWS 0.6 m. Height fraction = (1.0 − 0.6) ÷ (1.8 − 0.6) = 1/3. Correction = −0.033 m: LW height = 0.967 m, rounded to 1.0 m.
Seasonal changes and time
Mean sea level varies slightly through the year. The Admiralty standard-port predictions already include this seasonal change, but the differences do not. For best accuracy, remove the standard port's seasonal change, apply the differences, then add the secondary port's; around the UK it is rarely more than 0.1 m. Calculate in the printed time zone. Convert to local civil time at the end, adding summer time only if the published times exclude it.
Key figures
- Differences from
- A standard port with a similar tide, named in the table
- Time differences
- Interpolate by today's standard-port HW or LW time
- Height differences
- Interpolate between MHWS/MHWN or MLWN/MLWS
- Seasonal change
- Remove the standard port's, then add the secondary port's
- Worked answer
- HW 0830 4.3 m, LW 1507 1.0 m
- Spanish terms
- Puerto patrón, puerto secundario, diferencias de hora y altura
Remember
- A secondary port is worked from a standard port with a similar tide, not always the nearest.
- Interpolate time differences by today's HW or LW time at the standard port.
- Interpolate height differences between the mean spring and neap levels.
- Use the printed time zone; convert to local time once, only if needed.
Common mistakes
Wrong: Use the nearest tabulated difference without interpolating.
Right: Interpolate. A standard HW halfway between the two tabulated times takes the difference halfway between theirs.
Wrong: Read −0110 as 110 minutes earlier.
Right: Differences are hours and minutes: −0110 is 1 h 10 min earlier.
Wrong: Apply the HW height difference to the LW height as well.
Right: HW and LW have their own height differences, interpolated against their own mean levels.
Worked case
All times are UTC; seasonal corrections are zero. Standard HW is 0300, 5.0 m. HW differences are −0020 at 0000 and −0040 at 0600; at MHWS 5.0 m the height difference is −0.4 m. You need HW of at least 4.7 m before 0300. Does this tide meet both limits?
Show the answer
0300 lies halfway between 0000 and 0600, so the time difference is −0030. Secondary HW is 0230, meeting your time limit. The standard height equals MHWS, so apply −0.4 m: HW is 4.6 m above chart datum. This fails your 4.7 m height requirement, so the tide does not meet both limits. These answers remain in UTC.
Practice question
What does a secondary port's entry in the tide tables give you?
- Full daily times and heights of high and low water
- Time and height differences from a standard port
- Hourly tidal stream sets and rates for the harbour
- The chart datum and survey date for its own chart
Show the answer
Answer: B. A secondary port has no daily predictions. You apply its differences to a named standard port's HW and LW.
2 · Tidal curves
Tidal curves: height at a time and time for a height
A standard port's tidal curve turns HW and LW into a height for any time, or a time for any height, better than the rule of twelfths.
The curve diagram
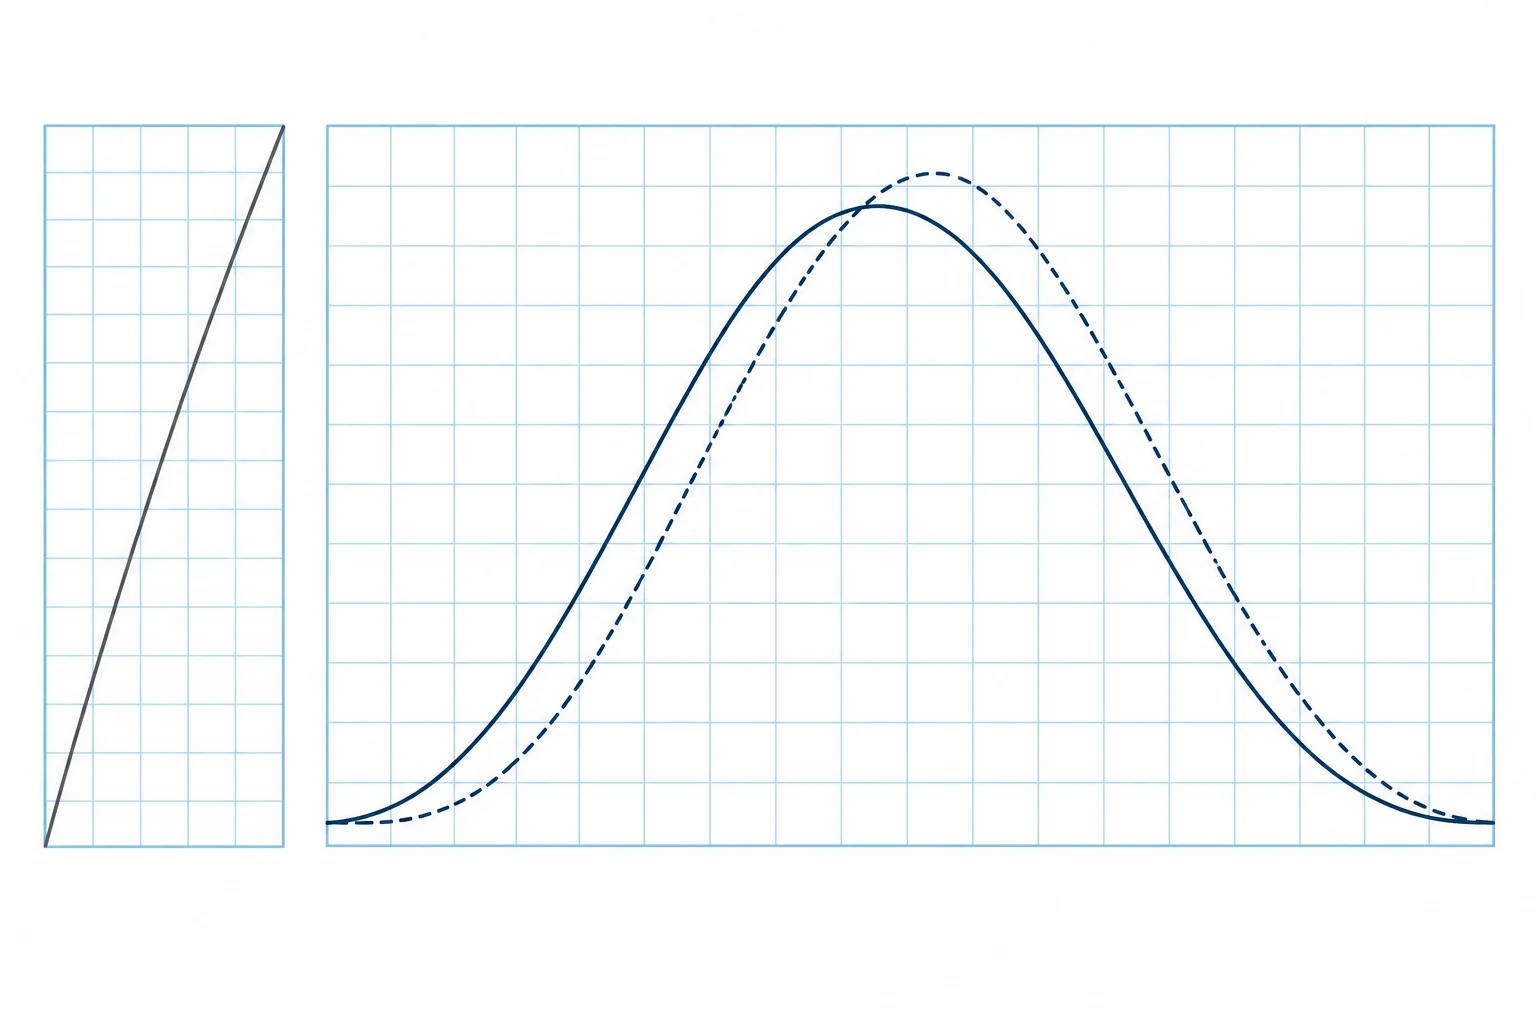
A standard-port tidal curve shows hours before and after HW. Enter today's HW time. Use the preceding LW for the rising branch and the following LW for the falling branch; their heights may differ. The factor runs from 0 at the relevant LW to 1 at HW. On the height grid, join that LW height on the bottom scale to the HW height on the top scale. This line converts the factor to height above chart datum.
Springs and neaps
Many curves show two lines: solid for mean springs and dashed for mean neaps. Work out today's range (HW height − LW height) at the standard port and compare it with the mean spring and neap ranges printed beside the diagram. Interpolate by eye between the two curves; beyond springs, use the spring curve. With mean ranges of 4.4 m and 2.2 m, a 3.6 m range lies about two thirds of the way towards springs.
Height at a time
Use the secondary-port tide from the last lesson: HW 0830 4.3 m, LW 1507 1.0 m, so the range is 3.3 m. You want the height at 1130, HW+3. Go up from HW+3 to the falling (right-hand) side of the curve; suppose it gives a factor of 0.60. Height of tide = LW + factor × range = 1.0 + 0.60 × 3.3 = 3.0 m above chart datum. The line on the height grid does the same multiplication for you.
Time for a height
Reverse it to find when there is enough water. You need 2.5 m on the falling tide: factor = (2.5 − 1.0) ÷ 3.3 = 0.45. Find 0.45 on the falling side and read the time scale. Suppose the curve gives about HW+3h40: 1210. After 1210 the tide is lower than 2.5 m. For a rising tide, recalculate with the preceding LW and use the left-hand side, counting from HW.
Which curve and how good
For a secondary port, use the standard port's curve with the secondary port's HW and LW, unless the tables give a curve of its own. The result is a prediction: wind and air pressure can change the real height by a few tenths of a metre, so keep a margin. Spanish Patrón de Yate exams set both problems: the depth at a given time, and the time for a given depth (problema directo e inverso).
Key figures
- Factor
- 0 at LW, 1 at HW
- Height of tide
- LW + factor × range
- Factor for a needed height
- (Needed height − LW) ÷ range
- Spring or neap curve
- Interpolate by today's range at the standard port
- Time scale
- Hours before and after the HW time written in the box
- Spanish terms
- Altura de marea, sonda en un momento, problema inverso
Remember
- The curve gives a factor from 0 at LW to 1 at HW; height = LW + factor × range.
- Choose between the spring and neap curves by today's range at the standard port.
- For a needed height, compute the factor first, then read the time off the curve.
- A secondary port normally uses its standard port's curve with its own HW and LW.
Common mistakes
Wrong: Use the spring curve every day.
Right: Compare today's range with the mean spring and neap ranges, and interpolate between the curves.
Wrong: Read the falling side of the curve for a time before HW.
Right: Before HW the tide is rising: use the left-hand side. After HW use the right-hand side.
Wrong: Treat the predicted height as exact.
Right: Weather moves the sea by tenths of a metre. Keep a margin on every height you depend on.
Worked case
You have allowed for charted depth, draught and your margin: you need a height of tide of 3.0 m. LW is 1.2 m; HW is 4.8 m at 1415. On the rising curve, factor 0.5 occurs at HW−2h50. Can you justify starting a crossing at 1120?
Show the answer
No. Range = 3.6 m; required factor = (3.0 − 1.2) ÷ 3.6 = 0.5. The predicted threshold is reached at 1125, five minutes after your planned start. Your margin is already included. Check actual conditions and confirm sufficient water throughout the crossing before proceeding. Use the falling curve to find when the window closes.
Practice question
LW is 1.2 m, the range is 3.0 m and the curve gives a factor of 0.6. What is the height of tide?
- 2.4 m
- 3.0 m
- 3.6 m
- 1.8 m
Show the answer
Answer: B. 1.2 + 0.6 × 3.0 = 1.2 + 1.8 = 3.0 m above chart datum.
3 · Twelfths' limits
The rule of twelfths and where it fails
The rule of twelfths checks a smooth, symmetrical six-hour tide. Double or distorted tides break the pattern; in small ranges, weather may dominate.
The rule in brief
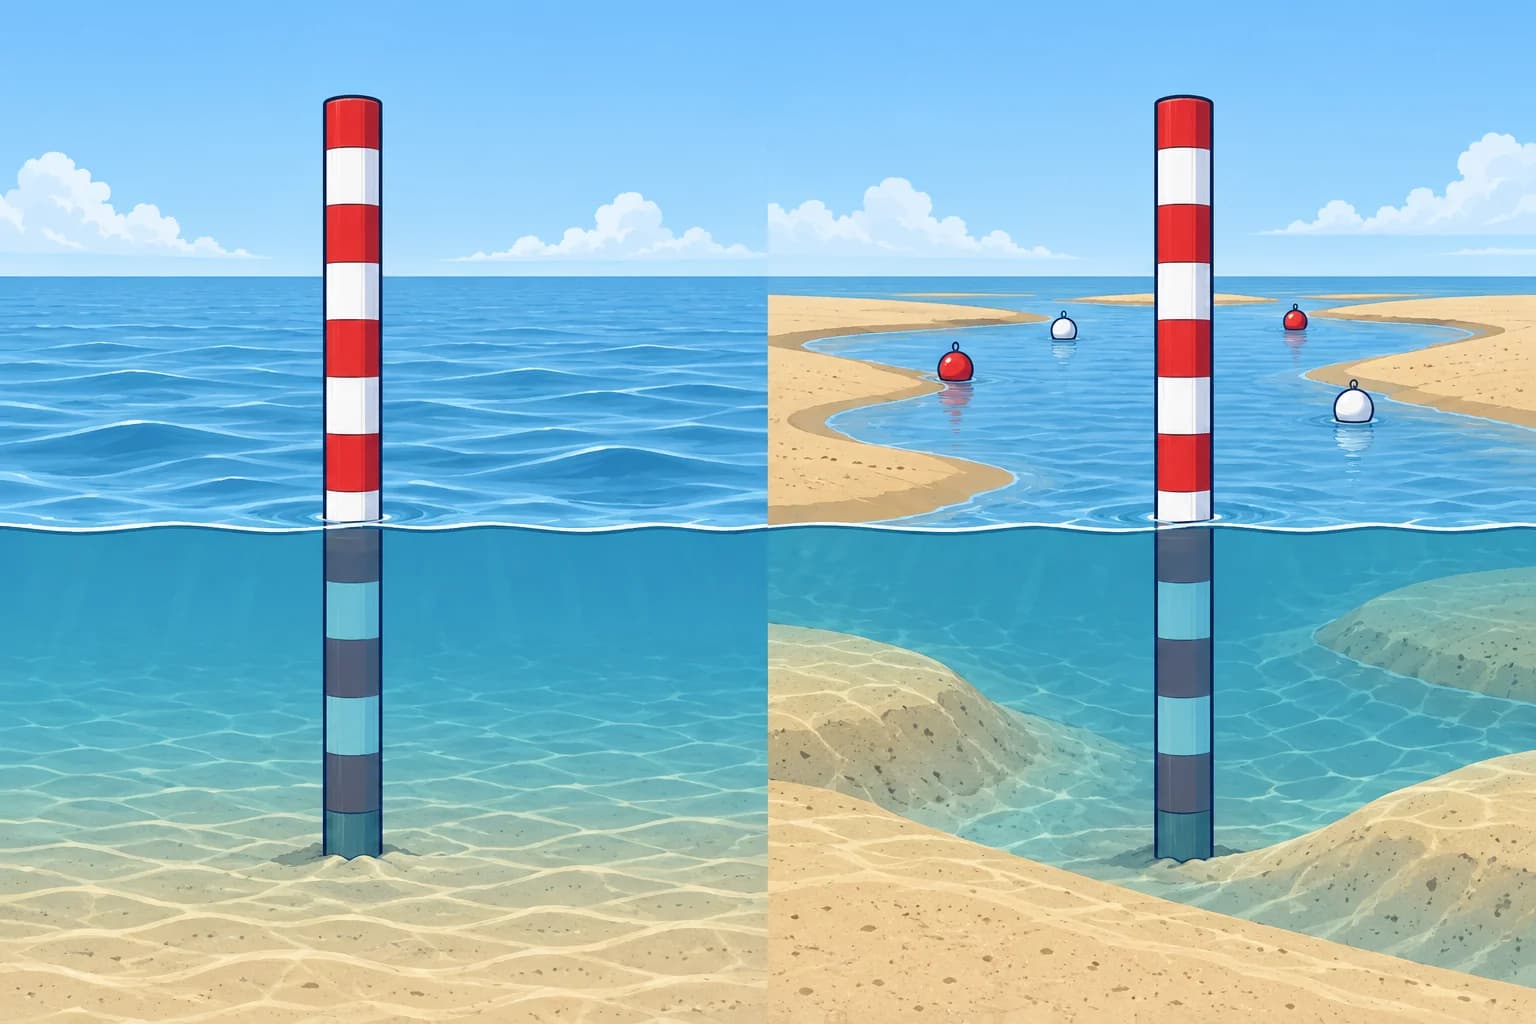
The rule of twelfths splits the rise or fall into six equal time steps carrying 1, 2, 3, 3, 2 and 1 twelfths of the range; the calculator on /navigation/tides works it through. With a 3.6 m range, after two steps 3/12 of it, 0.9 m, has come in. The rule assumes a smooth, symmetrical tide lasting about six hours. If the real duration differs, divide the actual duration by six. In a regular port it stays close to the curve.
Double tides
Some tides are not one smooth wave. Between Swanage and Selsey, the Admiralty special curves are referenced to LW. Southampton has double high water, two high-water peaks; other ports have a long stand, when the level changes little. Portland has double low water, while Le Havre has a long HW stand. Use each port's published curve and reference time; do not assume one timing convention or duration of rise applies everywhere. The twelfths do not reproduce these shapes.
Microtides
In much of the Mediterranean the astronomical range is less than half a metre; the northern Adriatic and the Gulf of Gabès are exceptions. There the weather matters as much as the Moon. Air pressure raises or lowers the sea by about 1 cm per hPa, so a deep low can add 0.2 m or more, and wind can pile water up against a coast or blow it away. Use official predictions and observed levels; weather can overwhelm a 0.3 m astronomical range.
Shallow water and rivers
Shallow water can distort the tide: the rise and fall may take different times, and the height may change unevenly within each period. Low water may occur later upriver, and heavy rain can raise low-water levels. Even with adjusted time steps, the twelfths may not fit the local curve. Use the port's own curve, local tables or harbour information.
Use it as a check
Work real decisions with the curve or official predictions, then use the twelfths to catch a gross error, such as a misread table or a mistaken sign. Where the tables print a warning or a special curve, follow it. If the sounder shows less water than expected, slow down and investigate before relying on your planned clearance.
Key figures
- Twelfths per sixth
- 1, 2, 3, 3, 2, 1 twelfths of the range
- Assumes
- About 6 h duration, smooth and symmetrical
- Swanage to Selsey
- Special curves timed from LW; double HW or long stand
- Air pressure
- About 1 cm per hPa; low pressure raises the sea
- Mediterranean
- Range often under 0.5 m; weather can dominate
Remember
- The twelfths assume a smooth, symmetrical tide of about six hours.
- Double high waters and stands, as round the Solent, need the tables' special curves.
- In microtidal seas, pressure and wind can matter as much as the predicted range.
- Use the twelfths to check a calculation, not to make a close-margin decision.
Common mistakes
Wrong: Apply the rule of twelfths at Southampton like anywhere else.
Right: The Solent has double high waters and stands. Use the special curves timed from LW.
Wrong: Ignore the barometer where the range is small.
Right: In a 0.3 m range, a deep low or a strong wind can change the level by as much as the tide itself.
Wrong: Always use six one-hour steps.
Right: Divide the actual duration from LW to HW by six; in an estuary even that is only rough.
Worked case
You plan to enter a shallow Mediterranean marina with 0.2 m to spare at mean sea level. The predicted range is 0.3 m, the barometer reads 1032 hPa and a fresh offshore wind has blown for two days. Is the margin enough?
Show the answer
No. High pressure about 20 hPa above average lowers the sea roughly 0.2 m, and a lasting offshore wind can lower it further near the coast. Your margin could vanish whatever the tide does. Check the marina's or port authority's sea-level information, wait for better conditions, or choose a deeper berth.
Practice question
The range is 3.6 m on a regular six-hour tide. By the rule of twelfths, how much has the tide risen two hours after LW?
- 0.3 m
- 0.6 m
- 1.2 m
- 0.9 m
Show the answer
Answer: D. 1/12 + 2/12 = 3/12 of 3.6 m = 0.9 m.
4 · Clearances
Clearances: bridges, air draught, shoals and drying heights
Under a bridge you need air above the masthead; over a shoal, water under the keel. Both depend on the height of tide and the chart's datums.
Air draught
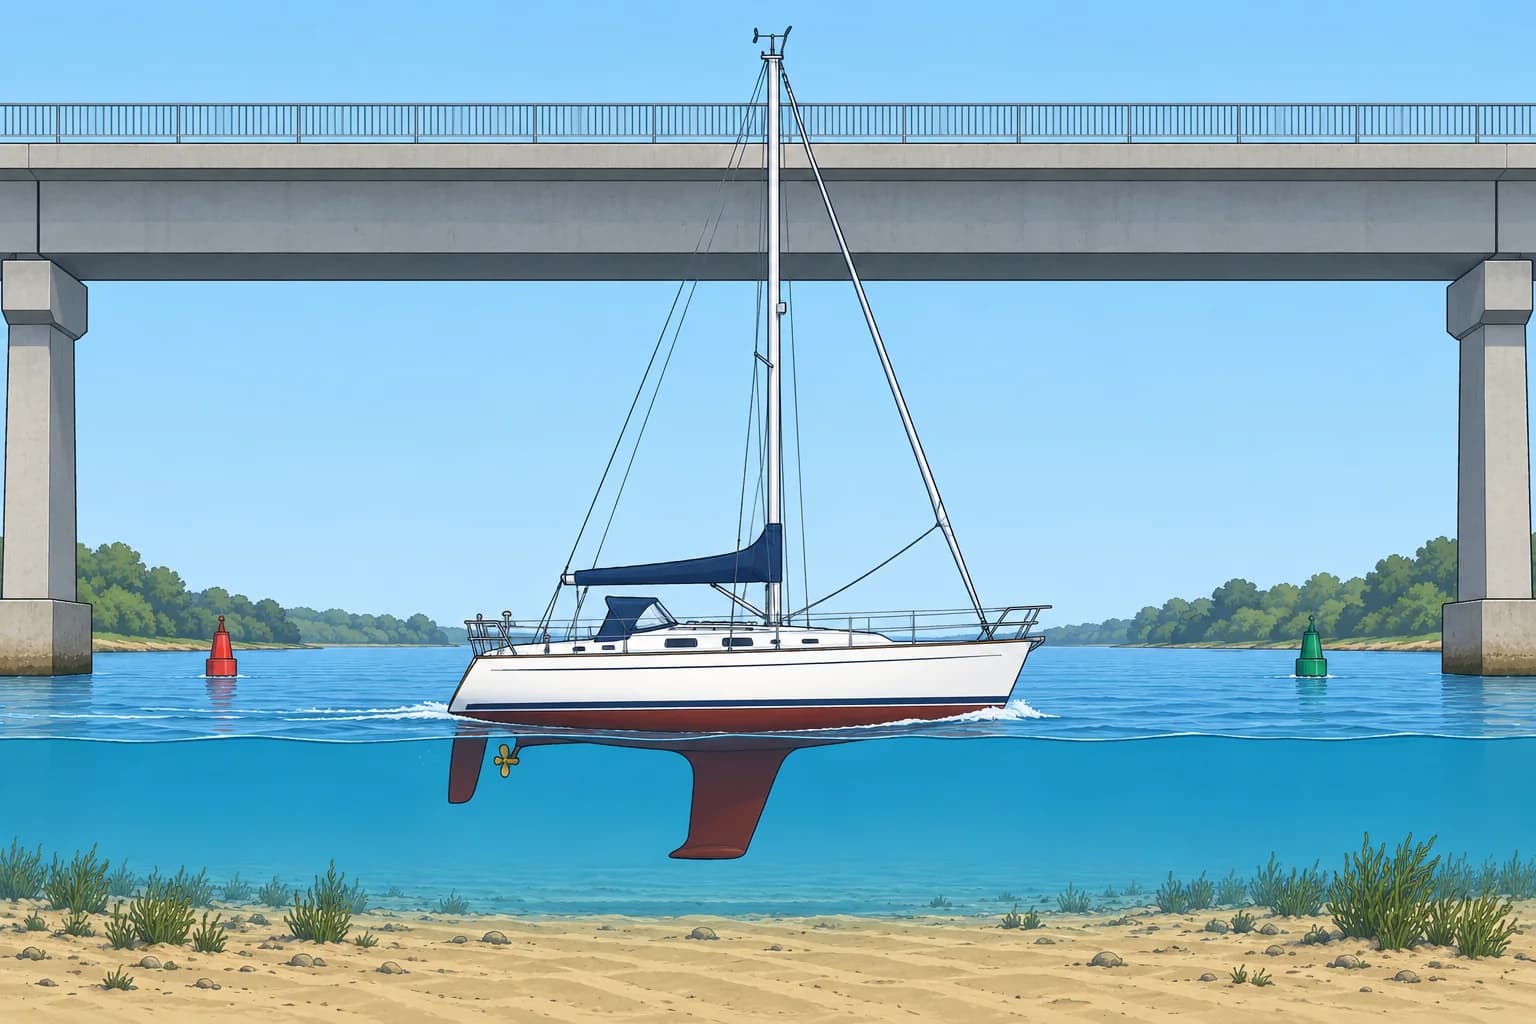
Air draught is the height of your boat's highest point above the waterline: masthead, VHF aerial, wind instrument or light. Measure it or get it from the builder, add whatever is fitted on top, and write it in the boat's papers. Spanish courses call it the calado aéreo. A lightly loaded boat floats a little higher, so take the figure for the lightest condition.
Clearance under a bridge
Read the chart's stated vertical-clearance datum first. Many Admiralty charts use HAT, highest astronomical tide; other charts use different levels, such as MHWS. For clearance above HAT, clearance now = charted clearance + HAT − height of tide. HAT and tide height must share chart datum. Under power cables, distinguish physical clearance from safe vertical clearance, which includes an allowance for electrical discharge, a spark jumping to your mast. Use the published safe value and local instructions.
Bridge worked example
A bridge has a charted clearance of 12.0 m above HAT; HAT there is 5.4 m. At the time you pass, the height of tide is 3.2 m: clearance = 12.0 + (5.4 − 3.2) = 14.2 m. Your air draught is 15.0 m and you want 1.0 m spare, so you need 16.0 m. The tide must be no higher than 5.4 − (16.0 − 12.0) = 1.4 m. Swell and wash make the mast pitch, so keep the margin generous.
Under-keel clearance
Under-keel clearance (UKC) is the water between your keel and the seabed. Over a sounding, depth = charted depth + height of tide. Over a drying height, shown underlined and measured above chart datum, depth = height of tide − drying height. Then UKC = depth − draught. Decide your minimum UKC first: more over rock, in swell, at speed and where the survey is old.
Shoal worked example
You draw 1.8 m and want 0.5 m under the keel over a bank drying 1.2 m. Needed height of tide = 1.2 + 1.8 + 0.5 = 3.5 m. Over a 2.4 m sounding with a height of tide of 1.6 m, depth = 4.0 m and UKC = 2.2 m. Turn each needed height into a time window with the tidal curve, and widen the margin when the barometer is high.
Key figures
- Bridge clearance now (above HAT)
- Charted clearance + (HAT − height of tide)
- Depth over a sounding
- Charted depth + height of tide
- Water over a drying height
- Height of tide − drying height
- UKC
- Depth − draught
- Needed height over a drying bank
- Drying height + draught + UKC wanted
- Spanish terms
- Calado aéreo, gálibo, resguardo bajo la quilla
Remember
- Know your air draught, aerials included, before you meet a bridge.
- For clearance above HAT, you gain HAT minus the height of tide.
- Over a drying height, water = height of tide − drying height.
- Set the UKC you need first, then find the time window from the tidal curve.
Common mistakes
Wrong: Compare your air draught with the charted clearance alone.
Right: Read the chart's clearance datum first. For clearance above HAT, add HAT minus the height of tide, then check your margin.
Wrong: Add a drying height to the height of tide.
Right: A drying height is above chart datum: subtract it from the height of tide.
Wrong: Measure air draught to the top of the mast only.
Right: Include the aerial, wind instrument and masthead light, which often add half a metre or more.
Worked case
A bridge's charted clearance is 10.5 m above HAT; HAT is 4.8 m. Your air draught is 13.0 m and you want 1.0 m spare. The height of tide falls through 2.0 m at 1340. Can you pass at 1400?
Show the answer
You need 14.0 m of clearance. The maximum height of tide is 4.8 − (14.0 − 10.5) = 1.3 m. At 1340, clearance is only 10.5 + 4.8 − 2.0 = 13.3 m. The height at 1400 is not given, so you cannot confirm passage then. Use the curve to find when the tide falls to 1.3 m or lower, and check conditions before passing.
Practice question
Charted clearance 12.0 m above HAT, HAT 5.4 m, height of tide 3.2 m. What is the clearance now?
- 8.8 m
- 12.0 m
- 14.2 m
- 17.4 m
Show the answer
Answer: C. 12.0 + (5.4 − 3.2) = 14.2 m.