Navigation · Level R3 · 5 parts · about 15 min
Chartwork: plotting courses, distances and bearings
5 short parts: Tools · Courses · Distance and time · Bearings · Logbook. Each part explains the idea, then gives the points to remember, the common mistakes, a worked case and a practice question; the Academy unit adds all 30 check questions.
1 · Tools
The chartwork tools: plotter, dividers and pencil
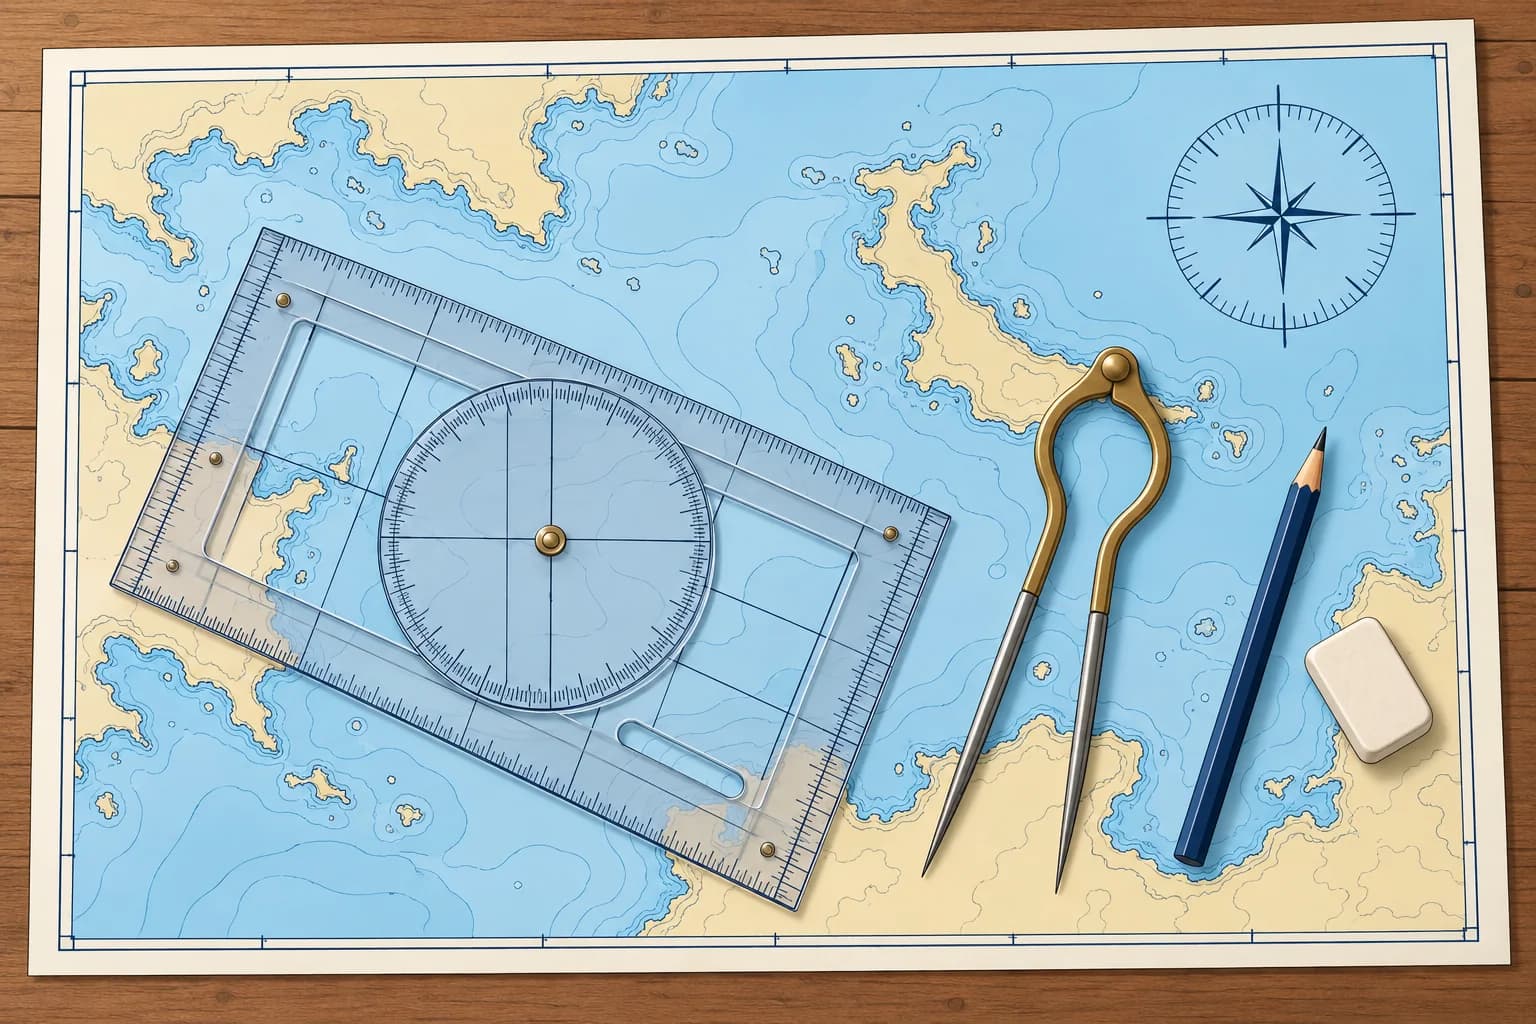
Chartwork needs only a few tools: a plotter to measure directions, dividers to measure distance, a soft pencil and a clean eraser.
The plotter
A plotter measures and draws chart directions. A Breton or Portland plotter has a rotating compass rose (direction scale). Lay its edge along your line, with its direction arrow pointing the way you want to measure. Turn the rose so its north–south grid lines follow a meridian (a chart longitude line), with the rose's north mark pointing to chart north. Read at the index mark.
Parallel rules
Ships and many older courses use parallel rules: two rulers joined by hinged arms. You walk them across the chart to the nearest compass rose printed on it, keeping the direction, and read the true direction on its outer ring. They are accurate on a large, flat chart table but slip on a small, moving one. With Spanish set squares, escuadra and cartabón, hold one fixed as a guide and slide the other along it to transfer the direction.
Dividers
Dividers have two sharp points. Open them across a distance on the chart, then carry them, without changing the opening, to the latitude scale beside it. One-handed dividers open and close with one hand, which helps on a moving boat. Keep the points sharp and the hinge stiff enough to hold its setting.
Pencil and eraser
Use a soft pencil, 2B or B, with a fine point, and a soft eraser. Hard pencils score the paper, and ink cannot be removed. Draw only the lines you need and rub out old work once it is finished, so the chart stays readable for years. Keep a watch or clock, the log reading and a notebook to hand.
Check by eye
Before you trust a measured direction, look at the line. A course running roughly south-west must read somewhere near 225°. The most common chartwork slip is reading the reciprocal, the opposite direction, 180° out.
Key figures
- Plotter
- N–S grid along a meridian, rose north to chart north; read at index
- Pencil
- 2B or B, sharp; soft eraser
- Distance
- Dividers on the latitude scale, level with the leg
- Spanish exam kit
- Escuadra, cartabón, compás (dividers) and a pencil
Remember
- Align the rose's north–south grid lines with a meridian, its north mark towards chart north.
- Dividers carry a distance to the latitude scale beside the leg.
- Use a soft, sharp pencil and rub out old work so the chart stays clear.
- Check every measured direction against a rough estimate by eye.
Common mistakes
Wrong: Align the plotter's grid with the edge of the chart table.
Right: Align the rose's north–south grid lines with a chart meridian, with its north mark towards chart north.
Wrong: Use a pen so the lines do not smudge.
Right: Use a soft 2B or B pencil. Lines must come off cleanly when the plan changes.
Wrong: Read the plotter and trust the number.
Right: Check the rough direction by eye first. A reading 180° out is the classic error.
Worked case
You lay a line from your harbour to a headland that is clearly to the south-west. The plotter reads 047°.
Show the answer
047° is north-east: the reciprocal of the direction you want. Point the plotter's direction arrow from the harbour towards the headland. Align the rose's north–south grid lines with a meridian, with its north mark towards chart north. Read again: about 227°T. Always compare the reading with a rough estimate.
Practice question
When measuring a course with a plotter, how should you align the rose's north–south grid lines?
- A meridian, with rose north towards chart south
- A meridian, with rose north towards chart north
- A parallel, with rose north towards chart east
- A parallel, with rose north towards chart west
Show the answer
Answer: B. Align the rose's north–south grid lines with a chart meridian and point its north mark to chart north. Read at the index.
2 · Courses
Laying off a course and checking it for dangers
Draw the course from departure to destination, measure its true direction, then check the whole line and a margin either side for dangers.
Terms
Your planned ground track is the line you intend to follow over the seabed. Your course to steer is the direction you intend to steer; your heading is where the bow actually points. Stream (water movement) and leeway (sideways movement caused by wind) can make your heading differ from your ground track. Chart directions are measured clockwise from true north (°T). Set and drift teaches how to find the required heading. Convert that true heading for the steering compass; see Compass course.
Laying it off
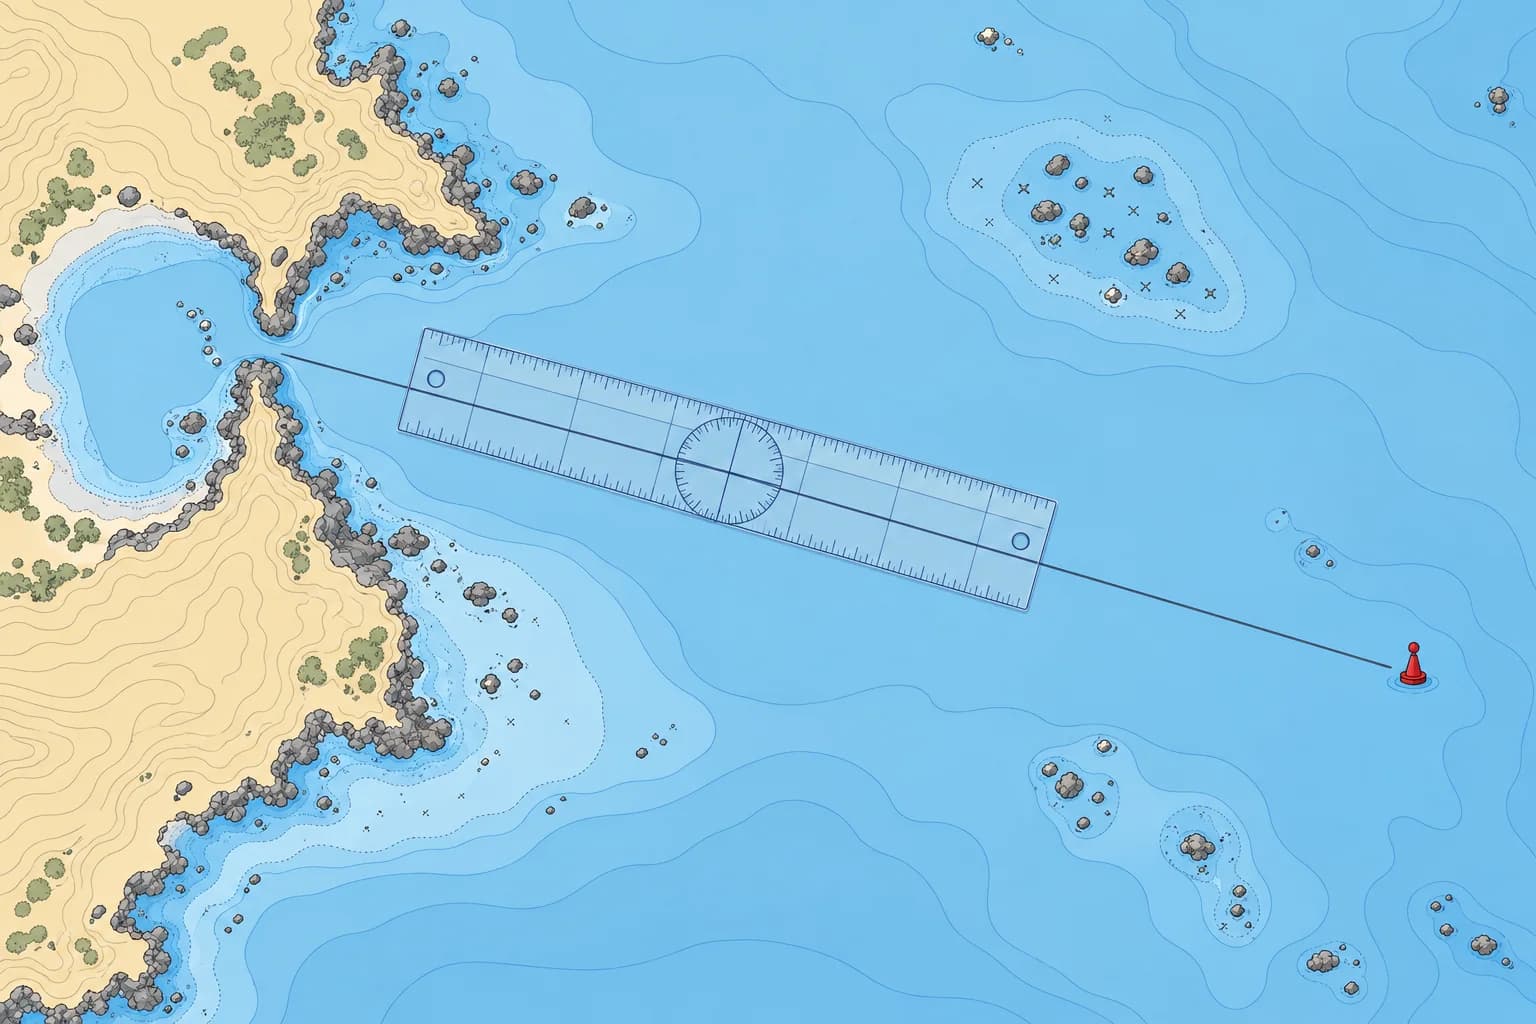
Mark your departure point and your destination or first waypoint (a chosen point on the route). Join them with a straight pencil line. On a Mercator chart this line, a rhumb line, crosses every meridian at the same angle, so its true track direction stays constant. On longer passages, break the route into legs at headlands, buoys or other turning points.
Measuring direction
Lay the plotter's edge along the line with its direction arrow pointing the way you will travel. Turn the rose until its north–south grid lines follow a meridian and its north mark points to chart north. Read the true track direction at the index, for example 227°T. Write it along the line with the leg's distance: "227°T 8.4 M".
Checking for dangers
A line on paper is not yet a safe track. Look along it and a good distance either side for rocks, shoals, wrecks, overfalls, fish farms, traffic separation schemes and restricted areas. Move the line if it passes too close. Allow more room off a lee shore (a coast the wind blows towards), at night, in poor visibility, and where the stream sets towards danger.
Keep it simple
Choose turning points you can recognise and reach safely. A leg may end near a buoy or another identifiable mark, with clearance from it. Check your progress before starting the next leg. The Pilotage unit covers more detailed coastal checks.
Key figures
- Chart directions
- True (°T): meridians point to true north
- Writing a leg
- Course and distance on the line, e.g. 227°T 8.4 M
- Rhumb line
- Straight on a Mercator chart; one angle to every meridian
- Safety margin
- Wider off a lee shore or where stream sets towards danger
Remember
- A plotted true track is not automatically the heading to steer.
- Point the plotter arrow along your track; align its north–south grid with a meridian and its north mark to chart north.
- Check the line and a margin either side for every danger, then adjust it.
- Break long routes into legs that end at marks you can identify.
Common mistakes
Wrong: The plotted true track is automatically the heading to steer.
Right: Wind and stream can move you sideways; Set and drift teaches how to find the heading.
Wrong: If the line misses the rocks, the course is safe.
Right: Check a margin either side. Stream, leeway and steering errors move you off the line.
Worked case
You plan a 12 M leg along a coast with an onshore wind of force 5. The straight line passes 2 cables off a rocky point.
Show the answer
Too close for these conditions. Over 12 M, a 1° steering error alone can use about 2 cables of clearance. Wind and stream may reduce it further. Replot with clearance suited to the wind, stream and uncertainty in your position, or add a waypoint well clear of the point. Note the new true direction and distance, and check the new line for dangers.
Practice question
A course measured against the chart's meridians is a…
- magnetic course
- true course
- compass course
- relative course
Show the answer
Answer: B. Chart meridians point to true north, so directions measured from them are true.
3 · Distance and time
Measuring distance and working with speed and time
Measure distance on the latitude scale beside the leg. Then distance, speed and time give you how far, how fast and when you will arrive.
Measuring distance
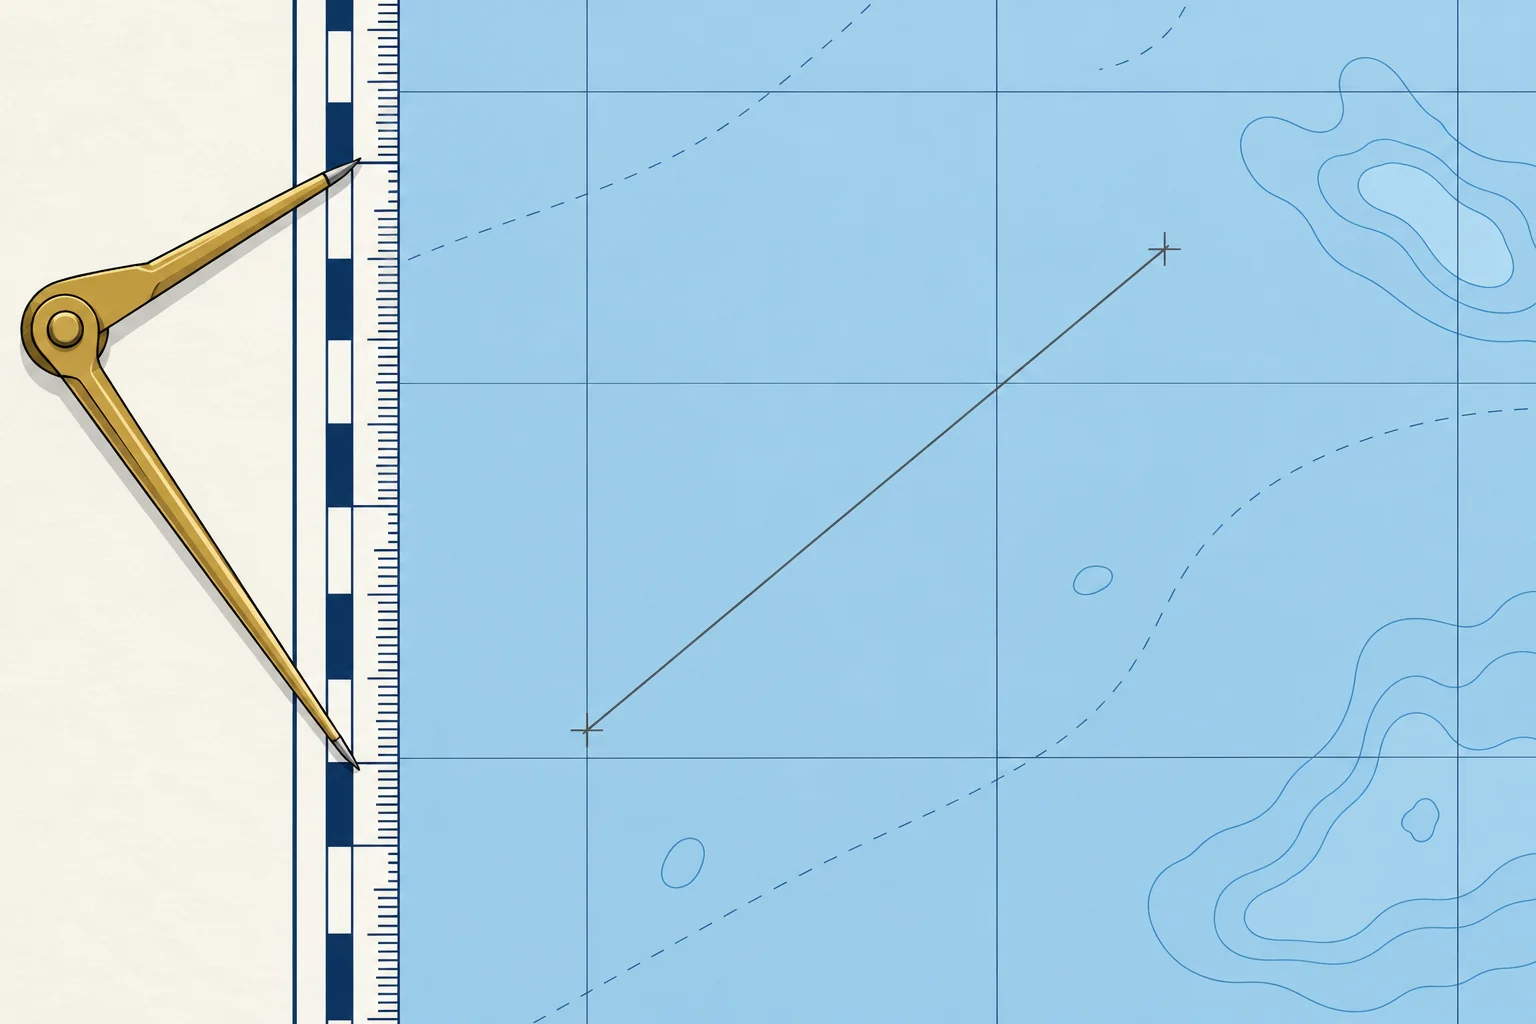
Open the dividers between the two ends of a leg. Carry them, unchanged, to the latitude scale at the side of the chart, at about the same latitude as the leg, and count the minutes. For chartwork, take one minute of latitude as one nautical mile (M). For a long leg, set the dividers to a round figure, such as 5 M, step along the line, then measure the remainder.
Why the side scale
On a Mercator chart the latitude scale stretches towards the poles, so a mile is longer on paper the further you are from the equator. Measuring level with the leg uses the right mile. The longitude scale along the top and bottom is not a distance scale. A large-scale harbour plan may carry its own scale bar.
Speed, time, distance
Distance = speed × time, with speed in knots (nautical miles per hour) and time in hours. Turn minutes into hours by dividing by 60. At 5.5 kn for 1 h 20 min: 5.5 × 80 ÷ 60 = 7.3 M. Rearranged, time = distance ÷ speed and speed = distance ÷ time. In 6 minutes, a tenth of an hour, you cover a tenth of your speed: at 6 kn, 0.6 M.
Working out an ETA
To find your ETA (estimated time of arrival), divide the remaining distance by your expected speed over the ground (SOG), then add that travel time to the present time. Use SOG rather than speed through the water (STW), shown by the log. A 9.0 M leg at 6.0 kn over the ground takes 1 h 30 min: leave at 10:40 and arrive at about 12:10.
Units
One nautical mile is 1852 m, and a cable is 0.1 M, about 185 m. Keep hours and minutes apart: 1.5 h is 1 h 30 min, not 1 h 50 min.
Key figures
- Distance
- Speed (kn) × time (h)
- Time
- Distance ÷ speed
- 6-minute rule
- Distance in 6 min = speed ÷ 10
- Nautical mile
- 1 M = 1852 m; 1′ latitude ≈ 1 M; 1 cable = 0.1 M
- Example
- 5.5 kn for 1 h 20 min = 7.3 M
Remember
- Measure distance on the latitude scale beside the leg, never on the longitude scale.
- Distance = speed × time, with time in hours: divide minutes by 60.
- In 6 minutes you cover one tenth of your speed, in miles.
- Work out an ETA with speed over the ground, which includes the stream.
Common mistakes
Wrong: 1.5 hours is 1 hour 50 minutes.
Right: 1.5 h is 1 h 30 min. Multiply the decimal part by 60 to get minutes.
Wrong: Measure distance on the scale at the top of the chart.
Right: That is the longitude scale. Use the latitude scale at the side, level with the leg.
Wrong: Use the log speed for the ETA, even with a foul stream.
Right: Use the expected speed over the ground. A foul stream (one against you) delays your arrival.
Worked case
You leave at 09:15 for a waypoint 7.5 M away. A crew member gives an ETA of 10:45 using 5 kn through the water. Expected speed over the ground is 4 kn. Do you accept that ETA?
Show the answer
No. Use speed over the ground for the charted distance: 7.5 ÷ 4 = 1.875 h, about 1 h 53 min. Revise the ETA to about 11:08. The earlier estimate uses speed through the water.
Practice question
At 6.0 kn, how far do you go in 40 minutes?
- 2.4 M
- 4.0 M
- 3.6 M
- 4.4 M
Show the answer
Answer: B. 6.0 × 40 ÷ 60 = 4.0 M.
4 · Bearings
Plotting a bearing as a position line
A bearing gives the direction from you to an object. Convert it to true, then draw it through the object: you are somewhere on that line.
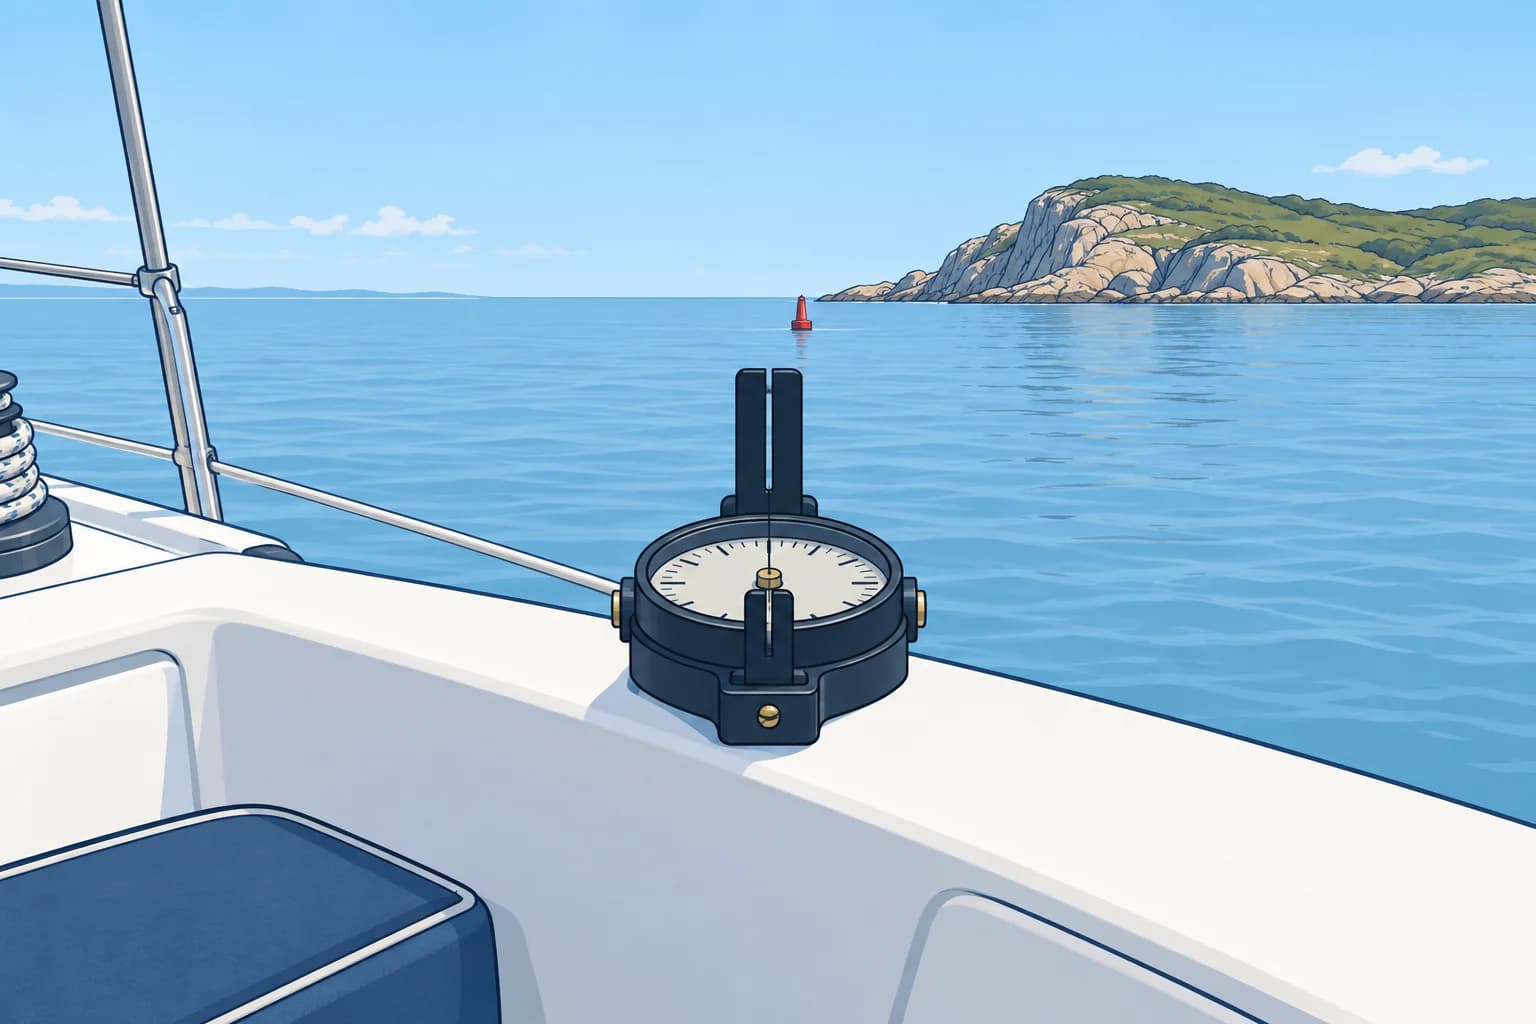
From bearing to line
A bearing is the direction from you to an object. If a charted tower bears 045°T from you, then you lie in the opposite direction from the tower, 225°T, somewhere along a straight line through it. That line is a position line: a line on which your position lies. One line does not give your position; two or more crossing lines do, as the Position fixing unit shows.
Make it true
A bearing from a hand-bearing compass is magnetic (°M). Convert it to true before plotting: with 3°W variation, 048°M becomes 045°T. Used well away from steel and electronics, a hand-bearing compass is normally taken to have no deviation, so only variation applies. A bearing read across the steering compass also needs that compass's deviation. The Compass course unit covers the conversion.
Drawing it
Set the plotter to the true bearing with its direction arrow pointing towards the object, north–south grid lines along a meridian and rose north towards chart north. Slide it until its edge passes through the charted object. Draw the line only near your likely position, not across the whole chart, and write the time on it.
Relative bearings
A relative bearing is measured from the bow, not from north: an object "45° on the starboard bow" lies 45° to the right of the heading. To plot it, turn it into a true bearing: add a starboard relative bearing to the true heading, or subtract a port one. Keep the result within 000°–359°: if it is 360° or more, subtract 360°; if it is negative, add 360°. Spanish courses call it a marcación.
Writing it
Note the object, the bearing with its reference and the time: "tower 048°M 14:20". Plot it soon after taking it. Without the time, you cannot reliably relate it to your other position records.
Key figures
- Magnetic to true
- Add east variation, subtract west
- Example
- 048°M with 3°W variation = 045°T
- Relative to true
- True heading + starboard, − port relative bearing
- Spanish terms
- Demora (bearing), marcación (relative bearing)
Remember
- A bearing gives a position line: you are somewhere on it, not at one point.
- Convert a magnetic bearing to true before you plot it.
- Draw the line through the charted object, only near your likely position.
- True bearing = true heading + a starboard relative bearing, or − a port one.
- Write the time on every position line.
Common mistakes
Wrong: Plot the magnetic bearing straight onto the chart.
Right: Convert it to true first. With 5°W variation, an unconverted bearing puts the line 5° out.
Wrong: One bearing gives your position.
Right: One bearing gives a line. You need a second line crossing it for a fix.
Worked case
Heading 080°T, a beacon is 60° on your port bow. A crew member labels its position line 020°M and marks an exact position somewhere on it. What must you correct?
Show the answer
The bearing is 080 − 60 = 020°T, because the heading is true. Label the line 020°T through the beacon and record its time. One bearing gives a position line, not an exact position; the marked point is unsupported.
Practice question
A hand-bearing compass gives 125°M. Variation is 4°W. What true bearing do you plot?
- 129°T
- 125°T
- 121°T
- 305°T
Show the answer
Answer: C. Going from magnetic to true, subtract west variation: 125 − 4 = 121°T.
5 · Logbook
Keeping the log: what to write and when
The logbook is the boat's written memory. Write down the time, log reading, heading and position every hour, and at every change.
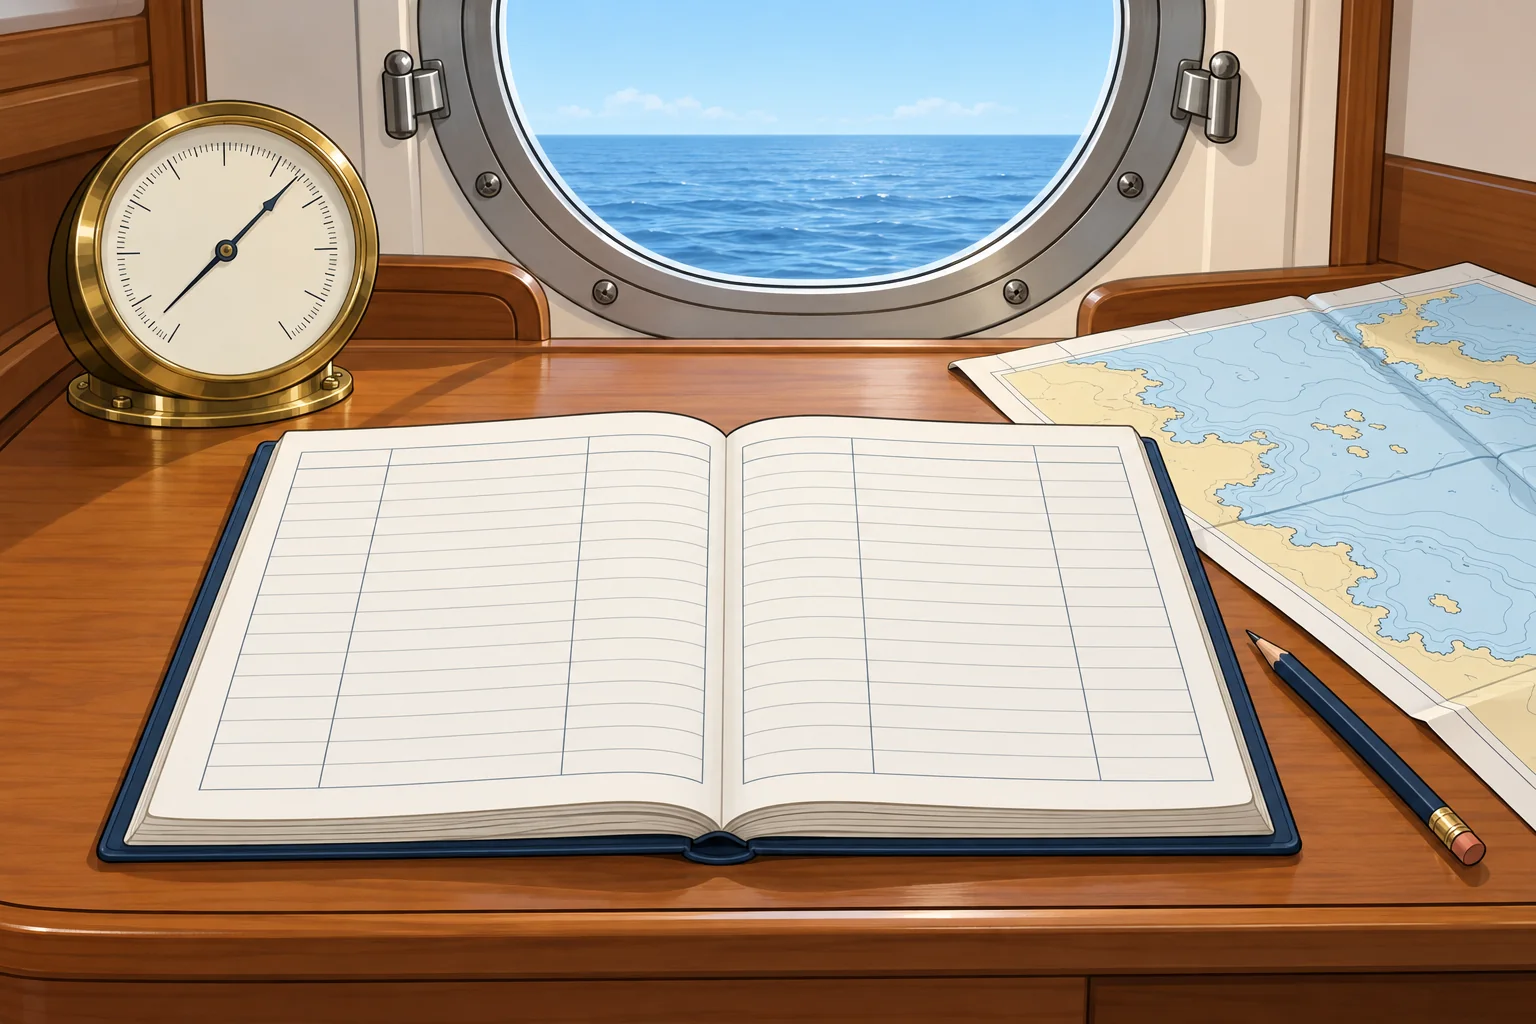
Why keep a log
The logbook records where you have been, in which direction and how fast. If the GNSS (satellite navigation) or plotter fails, the last entry is your starting point for dead reckoning: working out your position from heading, distance and time. It also shows weather trends and is a record after an incident. Many countries, the UK among them, do not require small pleasure craft to keep one by law, but some flag states do. Keep one anyway.
What to write
Each entry needs the time, the log reading (the distance run through the water, from the boat's speed and distance instrument, also called the log), the heading steered, labelled compass, magnetic or true, and the position with how it was found: a fix, a GNSS position or an estimate. Add the wind direction and force, the barometer reading (air pressure), sea state and visibility, and engine hours when motoring.
When to write
Make an entry at least every hour on passage, and more often near the coast or in poor visibility. Make one also at every course change, sail change, engine start or stop, mark passed and forecast received. Short intervals mean a short dead-reckoning run if the electronics fail.
Events
Note anything unusual: damage, a navigation light out, a VHF call, a reef taken in, a man-overboard drill. Keep entries brief and factual. Correct a mistake with a single line through it, so the original stays readable.
Electronic logs
A plotter track or an app can record much of this automatically, but it stops when the power or the GNSS fails. Keep at least an hourly written entry of position, log reading and heading.
Key figures
- Every entry
- Time, log reading, heading, position and its source
- Weather
- Wind direction and force, barometer, sea state, visibility
- How often
- At least hourly on passage; more often near danger
- Also log
- Course changes, marks passed, forecasts, events
Remember
- Log the time, log reading, heading and position at least every hour.
- Add an entry at every change: course, sails, engine, mark passed.
- Record the barometer: a steady fall over a few hours warns of wind.
- The last entry is your starting point if the electronics fail.
Common mistakes
Wrong: The plotter's track is all the log you need.
Right: Electronic tracks stop when power or GNSS fails. Keep an hourly written position, log reading and heading.
Wrong: Write the position without saying how you found it.
Right: Note whether it was a fix, a GNSS position or an estimate: they are not equally reliable.
Worked case
At 14:20 you change course and start the engine. Your last log entry was at 14:00. The plotter records your track automatically. What should you record now?
Show the answer
Make an entry now: time, log reading, new heading labelled compass, magnetic or true, position and how it was found, weather and engine hours. Note the course change and engine start; do not wait until 15:00. Keep the written record even while the plotter records a track.
Practice question
Which item belongs in every hourly log entry?
- The sea temperature
- The engine oil level
- The log reading
- The chart edition
Show the answer
Answer: C. With the time, heading and position, the log reading lets you rebuild your track by dead reckoning.